
有效计算信号的50 of分量
问题陈述
我有一个长信号(454912个样本),我想要计算一个50赫兹的数量在其中。在这里,速度比精度更重要。50赫兹电流的数量预计会随着时间的推移而波动。值需要代表整个记录,例如平均值。
上下文
该信号是从EEG电极记录的。当EEG电极与头皮接触不良时,信号中会产生大量的50 in电力线噪声。我想丢弃所有来自脑电图电极的数据,这些电极比其他电极具有更多的50赫兹噪声。
尝试解决方案
解决这个问题并不难。从FFT到Welch的任何方法都可以用来估计功率谱:
import numpy as np
from scipy.signal import welch

# generate an example signal
sfreq = 128.
nsamples = 454912
time = np.arange(nsamples) / sfreq
x = np.sin(2 * np.pi * 50 * time) + np.random.randn(nsamples)

# apply Welch' method to the problem
fs, ps = welch(x, sfreq)
print 'Amount of 50Hz:', ps[np.searchsorted(fs, 50)]
然而,在这里计算所有频率的功率似乎没有必要,我觉得有一个更有效的解决方案。类似于计算一个DFFT步骤的东西?用正弦波卷积?
回答 2
Stack Overflow用户
发布于 2015-02-03 15:14:32
韦尔奇法只计算信号的多个重叠段的周期图,然后取各段的平均值。这在频域上有效地将分辨率转换为降噪。
然而,为每个小部分执行许多单独的FFT将比为更大的部分计算更少的FFT更昂贵。根据您的需要,您可以使用韦尔奇的方法,但将您的信号分成更大的部分,和/或有较少的重叠(这两种方法都将减少您的方差在PSD)。
from matplotlib import pyplot as plt

# default parameters
fs1, ps1 = welch(x, sfreq, nperseg=256, noverlap=128)

# 8x the segment size, keeping the proportional overlap the same
fs2, ps2 = welch(x, sfreq, nperseg=2048, noverlap=1024)

# no overlap between the segments
fs3, ps3 = welch(x, sfreq, nperseg=2048, noverlap=0)

fig, ax1 = plt.subplots(1, 1)
ax1.hold(True)
ax1.loglog(fs1, ps1, label='Welch, defaults')
ax1.loglog(fs2, ps2, label='length=2048, overlap=1024')
ax1.loglog(fs3, ps3, label='length=2048, overlap=0')
ax1.legend(loc=2, fancybox=True)
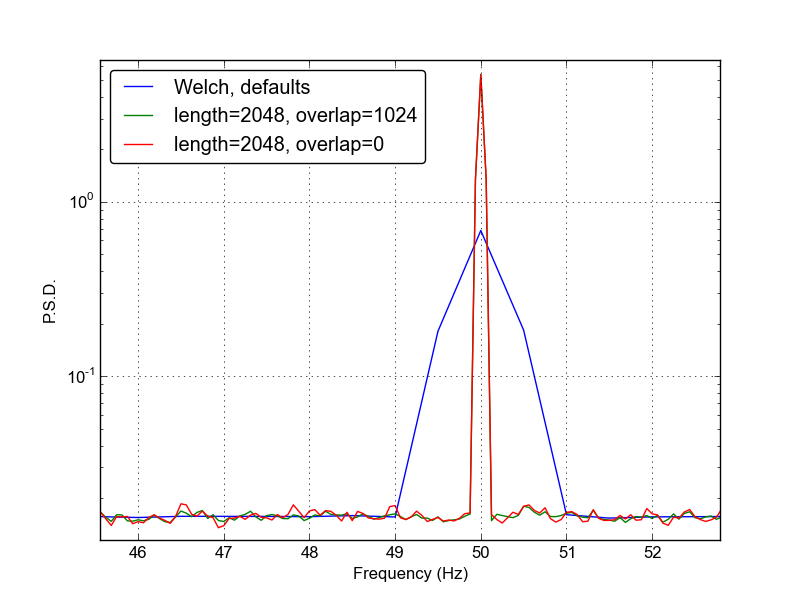
增加部分大小和减少重叠量可大大改善业绩:
In [1]: %timeit welch(x, sfreq)
1 loops, best of 3: 262 ms per loop

In [2]: %timeit welch(x, sfreq, nperseg=2048, noverlap=1024)
10 loops, best of 3: 46.4 ms per loop

In [3]: %timeit welch(x, sfreq, nperseg=2048, noverlap=0)
10 loops, best of 3: 23.2 ms per loop
请注意,对窗口大小使用2的功率是个好主意,因为对长度为2的信号进行FFT更快。
更新
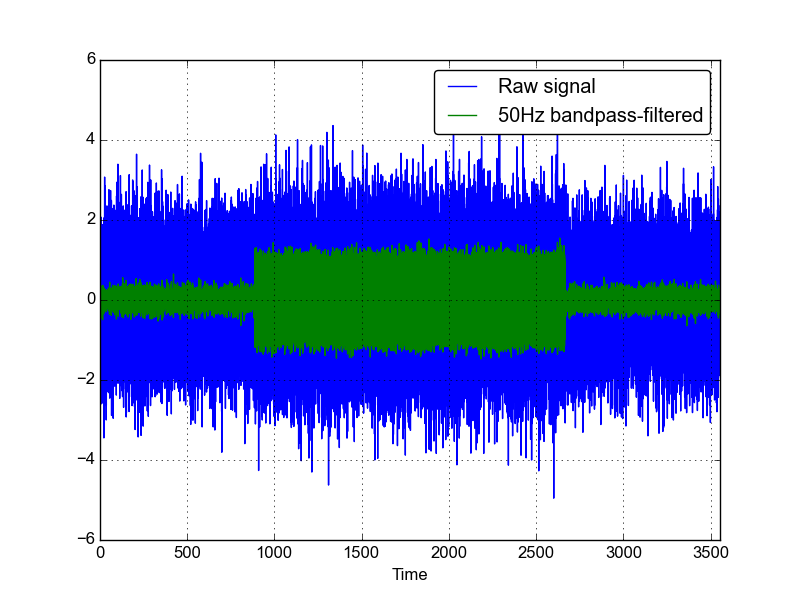
另一件简单的事情,你可能会考虑尝试,只是带通过滤你的信号中心50赫兹的陷波滤波器。滤波信号的包络将给你一个测量你的信号包含多少50赫兹功率随着时间的推移。
from scipy.signal import filter_design, filtfilt

# a signal whose power at 50Hz varies over time
sfreq = 128.
nsamples = 454912
time = np.arange(nsamples) / sfreq
sinusoid = np.sin(2 * np.pi * 50 * time)
pow50hz = np.zeros(nsamples)
pow50hz[nsamples / 4: 3 * nsamples / 4] = 1
x = pow50hz * sinusoid + np.random.randn(nsamples)

# Chebyshev notch filter centered on 50Hz
nyquist = sfreq / 2.
b, a = filter_design.iirfilter(3, (49. / nyquist, 51. / nyquist), rs=10,
                               ftype='cheby2')

# filter the signal
xfilt = filtfilt(b, a, x)

fig, ax2 = plt.subplots(1, 1)
ax2.hold(True)
ax2.plot(time[::10], x[::10], label='Raw signal')
ax2.plot(time[::10], xfilt[::10], label='50Hz bandpass-filtered')
ax2.set_xlim(time[0], time[-1])
ax2.set_xlabel('Time')
ax2.legend(fancybox=True)
更新2
看到@Hotpaw2的答案后,我决定尝试实现Goertzel算法,只是为了好玩。不幸的是,这是一个递归算法(因此不能随着时间的推移而被向量化),所以我决定自己编写一个Cython版本:
# cython: boundscheck=False
# cython: wraparound=False
# cython: cdivision=True

from libc.math cimport cos, M_PI

cpdef double goertzel(double[:] x, double ft, double fs=1.):
    """
    The Goertzel algorithm is an efficient method for evaluating single terms
    in the Discrete Fourier Transform (DFT) of a signal. It is particularly
    useful for measuring the power of individual tones.

    Arguments
    ----------
        x   double array [nt,]; the signal to be decomposed
        ft  double scalar; the target frequency at which to evaluate the DFT
        fs  double scalar; the sample rate of x (same units as ft, default=1)

    Returns
    ----------
        p   double scalar; the DFT coefficient corresponding to ft

    See: <http://en.wikipedia.org/wiki/Goertzel_algorithm>
    """

    cdef:
        double s
        double s_prev = 0
        double s_prev2 = 0
        double coeff = 2 * cos(2 * M_PI * (ft / fs))
        Py_ssize_t N = x.shape[0]
        Py_ssize_t ii

    for ii in range(N):
        s = x[ii] + (coeff * s_prev) - s_prev2
        s_prev2 = s_prev
        s_prev = s

    return s_prev2 * s_prev2 + s_prev * s_prev - coeff * s_prev * s_prev2
它的作用如下:
freqs = np.linspace(49, 51, 1000)
pows = np.array([goertzel(x, ff, sfreq) for ff in freqs])

fig, ax = plt.subplots(1, 1)
ax.plot(freqs, pows, label='DFT coefficients')
ax.set_xlabel('Frequency (Hz)')
ax.legend(loc=1)
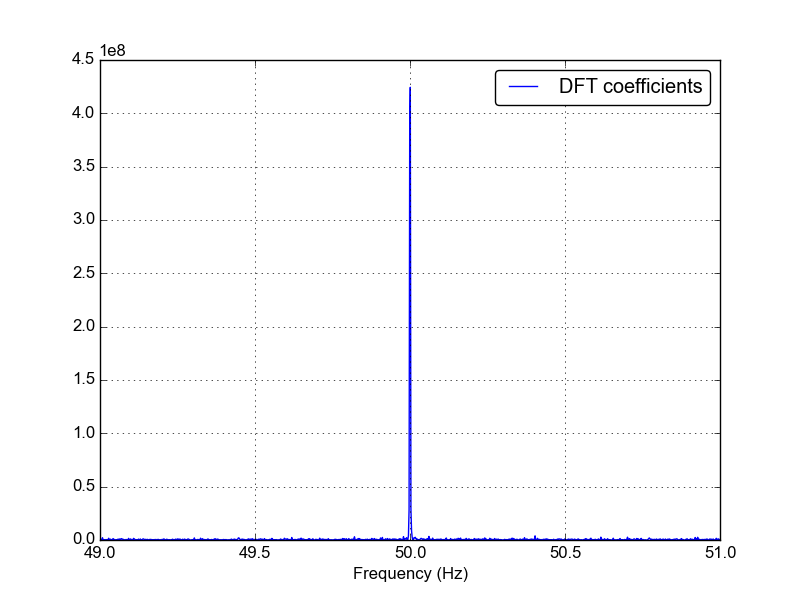
太快了:
In [1]: %timeit goertzel(x, 50, sfreq)
1000 loops, best of 3: 1.98 ms per loop
显然,这种方法只有当你只对一个频率而不是一个频率范围感兴趣时才有意义。
Stack Overflow用户
发布于 2015-02-03 17:05:50
对于单个正弦频率,可以使用Goertzel算法或Goertzel滤波器,这是一种计算效率高的方法,用于计算DFT或FFT结果的单个框的大小。
您可以在整个波形上运行此滤波器,或者将其与Welch方法结合使用,方法是将一系列Goertzel滤波器的幅值输出相加,并选择滤波器长度,这样滤波器的带宽就不会太窄(以涵盖50 Hz与采样率之间可能的轻微频率变化)。
通常,Goertzel滤波器与功率估计器结合使用,以确定所选频率的信噪比是否有效。
https://stackoverflow.com/questions/28298488
复制相似问题
腾讯云开发者

Copyright © 2013 - 2026 Tencent Cloud. All Rights Reserved. 腾讯云 版权所有
深圳市腾讯计算机系统有限公司 ICP备案/许可证号:粤B2-20090059 ![]() 粤公网安备44030502008569号
粤公网安备44030502008569号
腾讯云计算(北京)有限责任公司 京ICP证150476号 | 京ICP备11018762号