
如何用andrew_curves制作熊猫资料?
如何用andrew_curves制作熊猫资料?
提问于 2015-01-29 20:16:30
我有以下熊猫资料:
df = pd.read_csv('path/file/file.csv',
header=0, sep=',', names=['PhraseId', 'SentenceId', 'Phrase', 'Sentiment'])我想用曲线打印它,我尝试了以下几种方法:
andrews_curves(df, 'Name')知道怎么画这个吗?这是csv的内容:
PhraseId, SentenceId, Phrase, Sentiment
1, 1, A series of escapades demonstrating the adage that what is good for the goose is also good for the gander , some of which occasionally amuses but none of which amounts to much of a story ., 1
2, 1, A series of escapades demonstrating the adage that what is good for the goose, 2
3, 1, A series, 2
4, 1, A, 2
5, 1, series, 2
6, 1, of escapades demonstrating the adage that what is good for the goose, 2
7, 1, of, 2
8, 1, escapades demonstrating the adage that what is good for the goose, 2
9, 1, escapades, 2
10, 1, demonstrating the adage that what is good for the goose, 2
11, 1, demonstrating the adage, 2
12, 1, demonstrating, 2
13, 1, the adage, 2
14, 1, the, 2
15, 1, adage, 2
16, 1, that what is good for the goose, 2
17, 1, that, 2
18, 1, what is good for the goose, 2
19, 1, what, 2
20, 1, is good for the goose, 2
21, 1, is, 2
22, 1, good for the goose, 3
23, 1, good, 3
24, 1, for the goose, 2
25, 1, for, 2
26, 1, the goose, 2
27, 1, goose, 2
28, 1, is also good for the gander , some of which occasionally amuses but none of which amounts to much of a story ., 2
29, 1, is also good for the gander , some of which occasionally amuses but none of which amounts to much of a story, 2回答 1
Stack Overflow用户
回答已采纳
发布于 2015-01-29 20:42:42
在链接到的文档页中,Iris数据集有一个名为'Name'的列。当你打电话的时候
andrews_curves(data, 'Name')data的行按Name的值进行分组。这就是为什么对于Iris数据集来说,线条有三种不同的颜色。
在您的数据集中有三列:A、B、C。要在andrews_curves上调用df,首先需要标识要按其分组的值。例如,如果它是C列的值,则调用
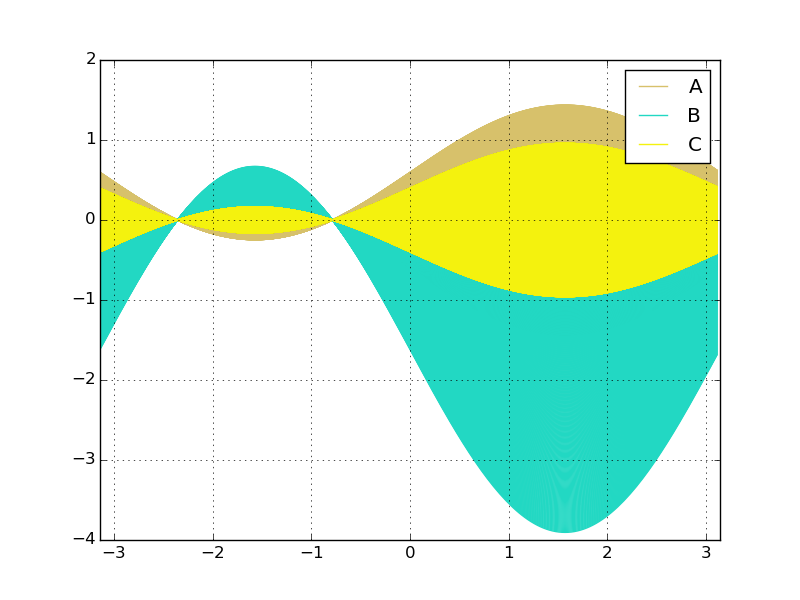
andrews_curves(data, 'C')另一方面,如果您想按列名、A、B、C进行分组,那么首先熔化您的DataFrame,将其从宽格式转换为长格式,然后在variable列上调用andrews_curves (该列保存每一行的值A、B或C ):
import numpy as np
import pandas as pd
import pandas.plotting as pdplt
import matplotlib.pyplot as plt

x = np.linspace(-1, 1, 1000)
df = pd.DataFrame({'A': np.sin(x**2)/x,
                   'B': np.sin(x)*np.exp(-x),
                   'C': np.cos(x)*x})
pdplt.andrews_curves(pd.melt(df), 'variable')
plt.show()
收益率
页面原文内容由Stack Overflow提供。腾讯云小微IT领域专用引擎提供翻译支持
原文链接:
https://stackoverflow.com/questions/28223793
复制相关文章
相似问题
腾讯云开发者

Copyright © 2013 - 2026 Tencent Cloud. All Rights Reserved. 腾讯云 版权所有
深圳市腾讯计算机系统有限公司 ICP备案/许可证号:粤B2-20090059 ![]() 粤公网安备44030502008569号
粤公网安备44030502008569号
腾讯云计算(北京)有限责任公司 京ICP证150476号 | 京ICP备11018762号