
是否有方法向Matplotlib中的传奇添加空条目?
是否有方法向Matplotlib中的传奇添加空条目?
提问于 2015-01-21 23:31:53
我想在python中的matplotib图中为一个图例添加一个空白。我在图例中有一些奇数的条目,目前看起来如下:
 _________________________________________________________________
|  handle1  -  label1   handle3  -  label3   handle5  -  label5  |
|  handle2  -  label2   handle4  -  label4                       |
但是,数据在逻辑上与控件成对分组,所以最好这样做:
 _________________________________________________________________
|  handle1  -  label1   handle2  -  label2   handle4  -  label4  |
|                       handle3  -  label3   handle5  -  label5  |
图例是在数据集上自动运行for循环时生成的:
for [folder1,folder2, label] in folder_list:
    parse_folder([folder1,folder2])
    color = next(colorgen)
    marker = next(markergen)
    ax1.errorbar(percent[0],percent[1], yerr=per_std, c=color, fmt=marker, label=label)
    if label == 'Flat Plate':
        print 'tripped'
        ax1.plot(np.NaN, np.NaN, '-', color='none', label=' ')
最后再打电话
leg = ax1.legend(loc='lower left',fancybox=True,prop={'size':fontsize-2},ncol=4,bbox_to_anchor=(-0.1, -0.315))有办法在传说中插入这个空白点吗?
回答 2
Stack Overflow用户
回答已采纳
发布于 2015-02-18 04:12:18
Farenorth的解决方案(在对Op的评论中给出)给出了最干净的答案。
在需要空白点的位置添加一个附加命令,使用np.NaN对数据进行数据处理,并将颜色设置为none。
ax1.plot(np.NaN, np.NaN, '-', color='none', label='')请注意,这必须是相同的类型,因为用于自动生成联想的方法按顺序获得不同的绘图类型,即所有绘图,然后是所有错误条等,因此空白条目需要是相同的类型,以保持函数调用的顺序。
Stack Overflow用户
发布于 2015-01-22 04:24:46
你可以定义一条假白线
l = Line2D([0],[0],color="w")然后绘制数据并将行/标记保存在变量中。
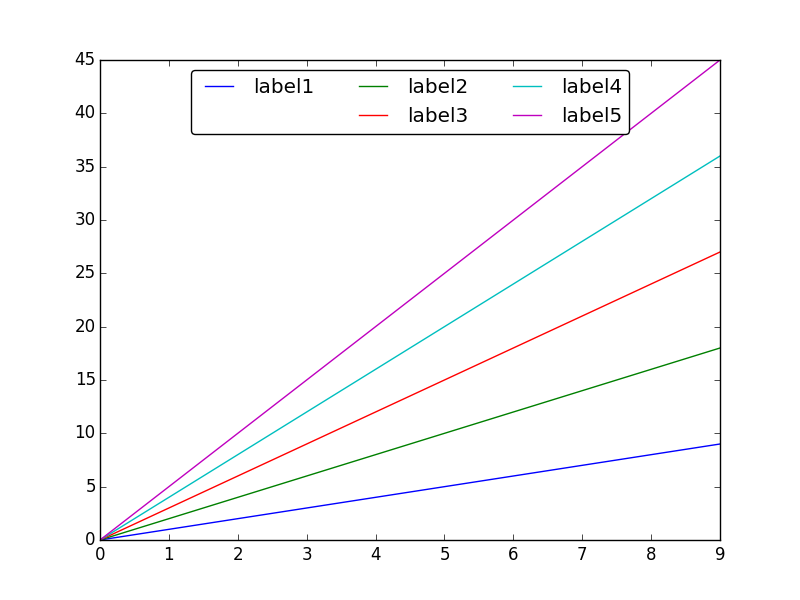
f = figure()
ax = f.add_subplot(111)

l1, = ax.plot(1*arange(10))
l2, = ax.plot(2*arange(10))
l3, = ax.plot(3*arange(10))
l4, = ax.plot(4*arange(10))
l5, = ax.plot(5*arange(10))最后,按以下方式调用legend
ax.legend((l1,l,l2,l3,l4,l5),("label1","","label2","label3","label4","label5"),
loc='upper center',fancybox=True,ncol=3)其中,每一行/标记都与不同的标签相关联。在您希望在图例中有空白的地方,插入假白线l并将一个空字符串关联到它。
希望能帮上忙。
页面原文内容由Stack Overflow提供。腾讯云小微IT领域专用引擎提供翻译支持
原文链接:
https://stackoverflow.com/questions/28078846
复制相关文章
相似问题
腾讯云开发者

Copyright © 2013 - 2026 Tencent Cloud. All Rights Reserved. 腾讯云 版权所有
深圳市腾讯计算机系统有限公司 ICP备案/许可证号:粤B2-20090059 ![]() 粤公网安备44030502008569号
粤公网安备44030502008569号
腾讯云计算(北京)有限责任公司 京ICP证150476号 | 京ICP备11018762号