
Python:垂直一维DotPlot
Python:垂直一维DotPlot
提问于 2015-01-20 12:18:49
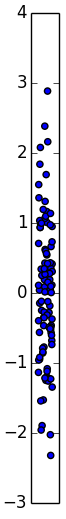
我正在尝试用python创建一个一维Dotplot,类似于以下内容:
https://owncloud.tu-berlin.de/public.php?service=files&t=9ead31dfc988757321c7ac391920c48a
我尝试使用matplotlib中的plot.scatter方法,但它需要x轴的数据。我尝试将所有x-值设置为“1”,但结果显示它是一种2d图,无论如何:
https://owncloud.tu-berlin.de/public.php?service=files&t=ab9f0f521f57526e871259f3a520d94a
我怎么才能画出真正的一维点画呢?我在材料库文件里什么也没找到.我想使用matplotlib,但也愿意听取其他建议。
提前感谢!
干杯,雅各布
回答 2
Stack Overflow用户
回答已采纳
发布于 2015-01-20 16:43:56
据我所见,你所展示的一维点图也是二维的,但仅在x方向上有很强的限制。
我不知道是否已经存在这样的东西,但是下面的代码是按照您的要求执行的。
import numpy as np
import matplotlib.pyplot as mpl

# your data
data = 3. + 0.7 * np.random.randn(N)

# a small spreading of the data in x direction
x = 0.2 * np.random.randn(data.size)

# the plotting
fig,ax = mpl.subplots(1,figsize=(0.5,5))
ax.set_axis_bgcolor('#FFD7B1')
ax.scatter(x,data,alpha=0.2,c='k')
ax.plot([-1,1],[np.mean(data),np.mean(data)],'r',linewidth=2)
ax.set_xlim((-1,1))
ax.set_ylim((1,6))
ax.set_xticks([])
ax.grid(True,axis='y')
ax.set_ylabel('Note')Stack Overflow用户
发布于 2015-01-20 16:44:27
你自己的解决方案已经接近了!只需在x轴上用宽径比与“壁球”的比例来缩小尺寸:
import numpy as np
import matplotlib.pyplot as plt
x = np.random.random(100)
y = np.random.randn(100)

fh, ax = plt.subplots(1,1)
ax.scatter(x,y)
ax.set_xlim(-.5, 1.5)
ax.axes.get_xaxis().set_visible(False)  # remove the x-axis and its ticks
ax.set_aspect(5, adjustable='box')  # adjustable='box' is important here
plt.show()
页面原文内容由Stack Overflow提供。腾讯云小微IT领域专用引擎提供翻译支持
原文链接:
https://stackoverflow.com/questions/28045238
复制相关文章
相似问题
腾讯云开发者

Copyright © 2013 - 2026 Tencent Cloud. All Rights Reserved. 腾讯云 版权所有
深圳市腾讯计算机系统有限公司 ICP备案/许可证号:粤B2-20090059 ![]() 粤公网安备44030502008569号
粤公网安备44030502008569号
腾讯云计算(北京)有限责任公司 京ICP证150476号 | 京ICP备11018762号