
低通理想滤波器的matlab 2014 a实现
低通理想滤波器的matlab 2014 a实现
提问于 2014-12-04 15:33:30
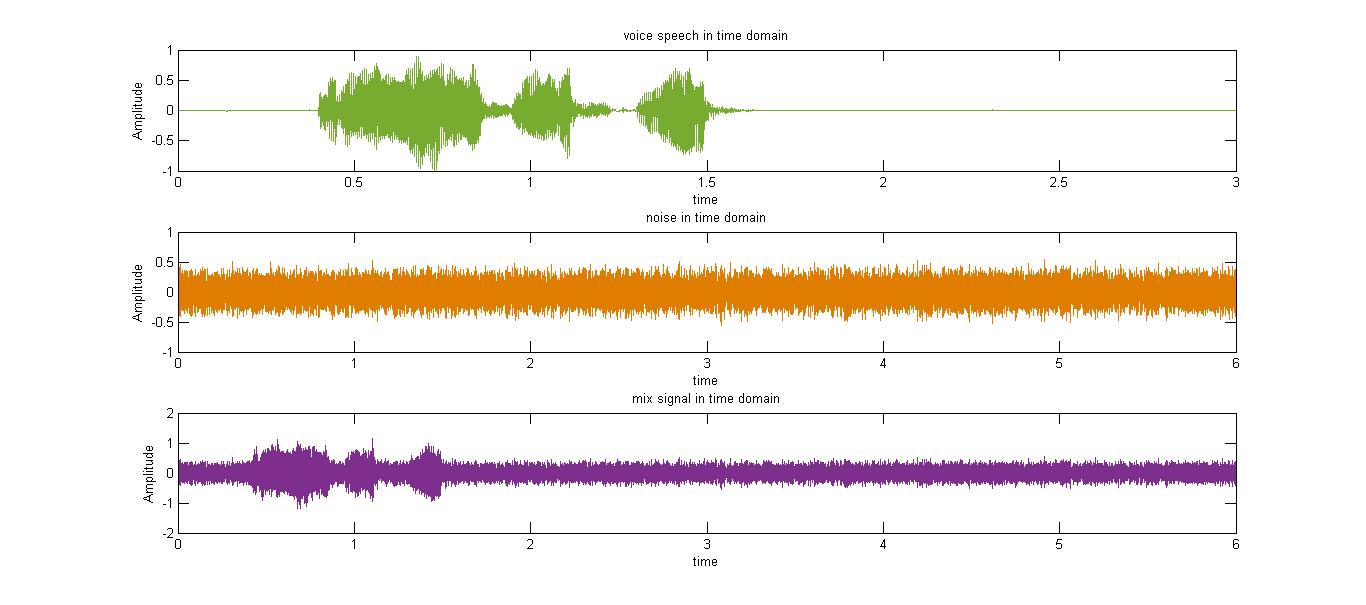
在这里,我必须发出声音信号--一个是男性语音信号,另一个是噪声信号--我把它们加在一起--称之为“混合”信号--现在我被要求过滤它,以便去除噪音,剩下的只有男性语音信号。分析了男性语音和噪声的时域和频域图。
时域 1:https://www.dropbox.com/s/m5frew6f0qlbae5/filteres%20signal.jpg?dl=0
频域
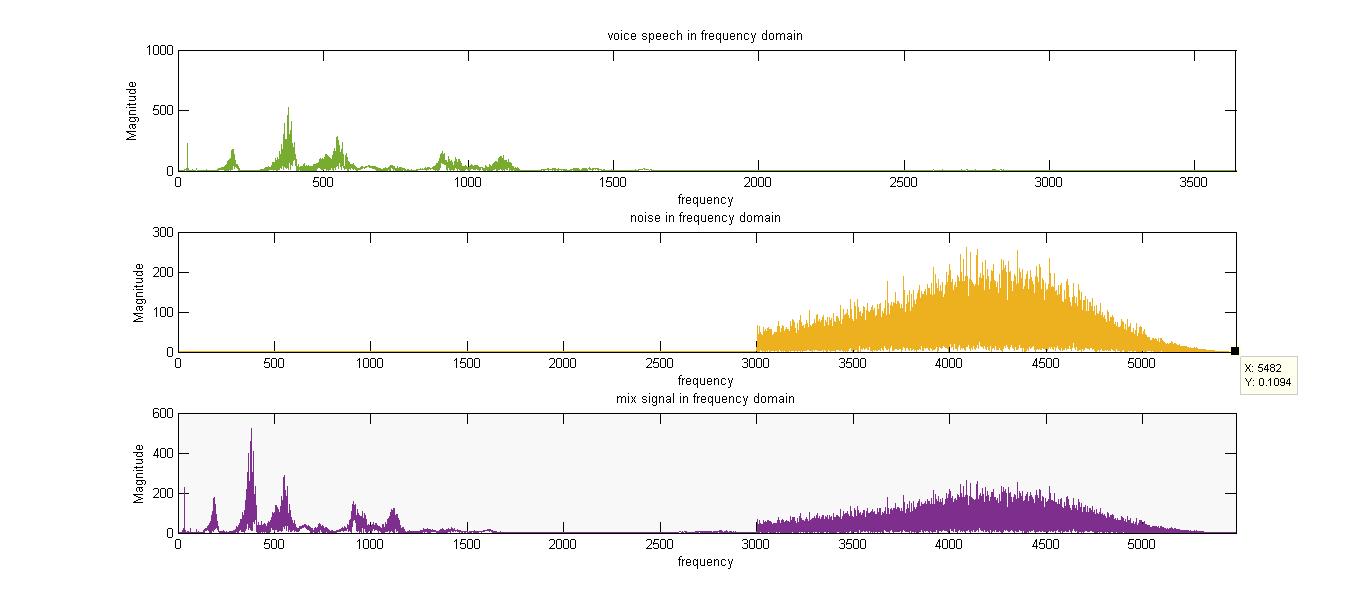
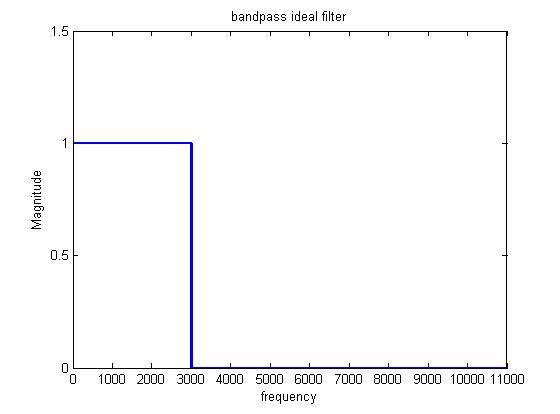
我观察到男性语音的最大频率比噪声的最小频率小一些,所以我做了一个低通滤波器--使用rect函数--并在频域对其进行滤波。
理想低通滤波器
我在频域和时域绘制了得到的信号,频域的图和频域的男性语音图是相同的,但在时域上却不完全相同。
滤波信号
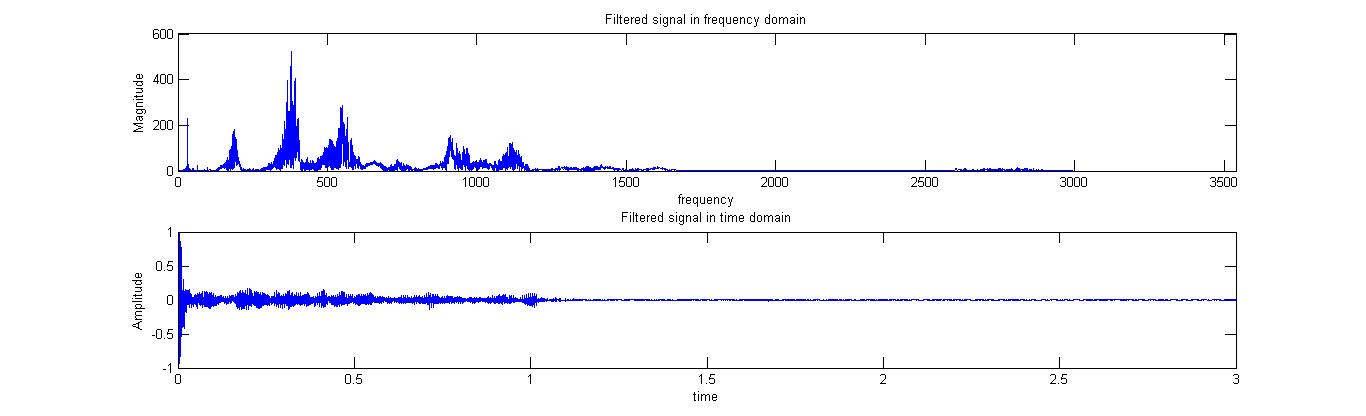
当我发出信号时,我也注意到了变化。有什么帮助,请知道为什么滤波的信号不是完全像原来的男性讲话?
*P.S:我知道以这种方式进行过滤是不够的,但目前我们应该在我的课程报告中这样做。
这里是我的代码:
[voice,Fs] = audioread ('hamid1.wav');
[noise,Fs] = audioread ('noise.wav');
voice(55126: 131072)=0 % to add both voice and noise signal together their dimensio must agree
mix = voice + noise; % the mixed signal

%vp = audioplayer(voice,Fs);
%play(vp);
%-- data for plotting voice --%
iFs = 1/Fs;
voiceLen = length(voice);
voiceF0 = 1/(iFs*voiceLen);
f_voice = 0:voiceF0: (voiceLen-1)*voiceF0;
t_voice = 0:iFs:(voiceLen-1)*iFs;
mag_voice = abs(fft(voice));

%-- data for plotting noise --%
noiseLen = length(noise);
noiseF0 = 1/(iFs*noiseLen);
f_noise = 0:noiseF0: (noiseLen-1)*noiseF0;
t_noise = 0:iFs:(noiseLen-1)/Fs;
mag_noise = abs(fft(noise));
%--------------------------------------------%

%-- data for plotting mix --%
mixLen = length(mix);
mixF0 = 1/(iFs*mixLen);
f_mix= 0:mixF0: (mixLen-1)*mixF0;
t_mix = 0:iFs:(mixLen-1)/Fs;
mag_mix = abs(fft(mix));

%-- plotting voice speech, noise and mix in frequency domain --%
figure(1);
subplot(3,1,1);
plot(f_voice,mag_voice);
title('voice speech in frequency domain');
xlabel('frequency'); ylabel('Magnitude');
subplot(3,1,2);
plot(f_noise,mag_noise);
title('noise in frequency domain');
xlabel('frequency'); ylabel('Magnitude');
subplot(3,1,3);
plot(f_mix,mag_mix);
title('mix signal in frequency domain');
xlabel('frequency'); ylabel('Magnitude')

%-- plotting voice speech, noise and mix in time domain --%
figure(2);
subplot(3,1,1);
plot(t_voice,voice);
title('voice speech in time domain');
xlabel('time'); ylabel('Amplitude');
subplot(3,1,2);
plot(t_noise,noise);
title('noise in time domain');
xlabel('time'); ylabel('Amplitude');
subplot(3,1,3);
plot(t_mix, mix);
title('mix signal in time domain');
xlabel('time'); ylabel('Amplitude')

%-- design the bandpass filter --
rect = 1*(f_mix>=0 & f_mix <3000);
rect2= rect+0*(f_mix>=3000 & f_mix <5482);
%-- plotting the ideal filter --%
figure(3)
plot(f_mix, rect2,'linewidth',2);
title('bandpass ideal filter');
xlabel('frequency'); ylabel('Magnitude')
axis([0 11000 0 1.5])

%-- Filtering the mix signal to extract voice speech without noise --%
filtered = rect2.*mag_mix'
filteredT = ifft(filtered)

figure(4)
subplot(2,1,1)
plot(f_mix, filtered)
title('Filtered signal in frequency domain')
xlabel('frequency')
ylabel('Magnitude')

subplot(2,1,2)
plot(t_mix, real(filteredT))
title('Filtered signal in time domain')
xlabel('time')
ylabel('Amplitude')
%-------------------------------------------%
filtSig = audioplayer(filteredT,Fs)
play(filtSig)回答 1
Stack Overflow用户
回答已采纳
发布于 2014-12-04 19:36:36
这里有一个提示-一个理想的过滤器可实现吗?你理想的低通滤波器的逆傅里叶变换是什么?我看过这些东西已经有一段时间了,但我不认为你会出错。相反,你看到了过于严格的过滤器设计的效果。
页面原文内容由Stack Overflow提供。腾讯云小微IT领域专用引擎提供翻译支持
原文链接:
https://stackoverflow.com/questions/27297859
复制相关文章
相似问题
腾讯云开发者

Copyright © 2013 - 2026 Tencent Cloud. All Rights Reserved. 腾讯云 版权所有
深圳市腾讯计算机系统有限公司 ICP备案/许可证号:粤B2-20090059 ![]() 粤公网安备44030502008569号
粤公网安备44030502008569号
腾讯云计算(北京)有限责任公司 京ICP证150476号 | 京ICP备11018762号