
用matplotlib绘制的loglog图在pyqt轴上消失
用matplotlib绘制的loglog图在pyqt轴上消失
提问于 2014-11-08 17:23:55
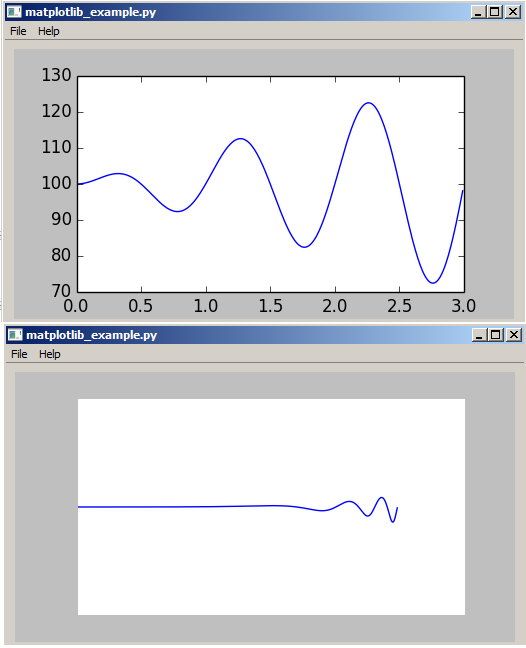
我试图在PyQt4中使用matplotlib绘图库来绘制日志图。我在类中添加了两行代码:
class MyStaticMplCanvas(MyMplCanvas):
    """Simple canvas with a sine plot."""
        def compute_initial_figure(self):
            t = arange(0.0, 3.0, 0.01)
            s = abs((t * 1E+1) * sin(2 * pi * t) + 1E1)

            self.axes.plot(t, s)
            self.axes.set_yscale('log') #added code
            self.axes.set_xscale('log') #added code
但后来斧头消失了,在下面出现了一个错误。我想问您如何使用PyQt4中的matplotlib库来绘制loglot图。如下图所示。Python2.7.5,matplotlib 1.3.0,PyQt 4.10.4
Traceback (most recent call last):
  File "C:\Python27\Lib\site-packages\matplotlib\backends\backend_qt4.py", line 299, in resizeEvent
    self.draw()
  File "C:\Python27\Lib\site-packages\matplotlib\backends\backend_qt4agg.py", line 148, in draw
    FigureCanvasAgg.draw(self)
  File "C:\Python27\Lib\site-packages\matplotlib\backends\backend_agg.py", line 451, in draw
    self.figure.draw(self.renderer)
  File "C:\Python27\Lib\site-packages\matplotlib\artist.py", line 54, in draw_wrapper
    draw(artist, renderer, *args, **kwargs)
  File "C:\Python27\Lib\site-packages\matplotlib\figure.py", line 1034, in draw
    func(*args)
  File "C:\Python27\Lib\site-packages\matplotlib\artist.py", line 54, in draw_wrapper
    draw(artist, renderer, *args, **kwargs)
  File "C:\Python27\Lib\site-packages\matplotlib\axes.py", line 2086, in draw
    a.draw(renderer)
  File "C:\Python27\Lib\site-packages\matplotlib\artist.py", line 54, in draw_wrapper
    draw(artist, renderer, *args, **kwargs)
  File "C:\Python27\Lib\site-packages\matplotlib\axis.py", line 1093, in draw
    renderer)
  File "C:\Python27\Lib\site-packages\matplotlib\axis.py", line 1042, in _get_tick_bboxes
    extent = tick.label1.get_window_extent(renderer)
  File "C:\Python27\Lib\site-packages\matplotlib\text.py", line 754, in get_window_extent
    bbox, info, descent = self._get_layout(self._renderer)
  File "C:\Python27\Lib\site-packages\matplotlib\text.py", line 329, in _get_layout
    ismath=ismath)
  File "C:\Python27\Lib\site-packages\matplotlib\backends\backend_agg.py", line 210, in get_text_width_height_descent
    self.mathtext_parser.parse(s, self.dpi, prop)
  File "C:\Python27\Lib\site-packages\matplotlib\mathtext.py", line 3009, in parse
    self.__class__._parser = Parser()
  File "C:\Python27\Lib\site-packages\matplotlib\mathtext.py", line 2193, in __init__
    - ((lbrace + float_literal + rbrace)
TypeError: unsupported operand type(s) for +: 'NoneType' and 'NoneType'回答 1
Stack Overflow用户
回答已采纳
发布于 2014-11-08 17:55:43
这可能是因为x范围包括0。真正的木材比例尺不能达到0。如果您想包含0,则需要使用'semilog'。
从您收到的错误消息来看,我敢打赌您使用的是一个相当老的matplotlib版本?值得注意的是,在较新的版本中,包括0在内,将自动将标度更改为semilog而不是log。
无论哪种方法,都尝试指定一个半自动缩放,看看这是否有帮助。例如。
self.axes.set(xscale='semilog', yscale='semilog')页面原文内容由Stack Overflow提供。腾讯云小微IT领域专用引擎提供翻译支持
原文链接:
https://stackoverflow.com/questions/26819939
复制相关文章
相似问题
腾讯云开发者

Copyright © 2013 - 2026 Tencent Cloud. All Rights Reserved. 腾讯云 版权所有
深圳市腾讯计算机系统有限公司 ICP备案/许可证号:粤B2-20090059 ![]() 粤公网安备44030502008569号
粤公网安备44030502008569号
腾讯云计算(北京)有限责任公司 京ICP证150476号 | 京ICP备11018762号