
与线重无关的设定点大小
我在gnu图中定义了以下行样式:
set linetype 1 lc rgb "red" lw 3 pt 7
set linetype 3 lc rgb "red" lw 1 pt 7看起来,这些点的部分大小来自于线的重量。我在plot for循环中使用这些样式,linetype cycle对c样条和对应的点使用相同的样式,所以我不认为只为这些点定义单独的样式是很容易的。
我得到了这样的结果:

这些点响应于pointsize,但线型1中的点仍然稍大一些(可能来自较厚的边框)。
这两种样式中的点是否可能是相同大小的?
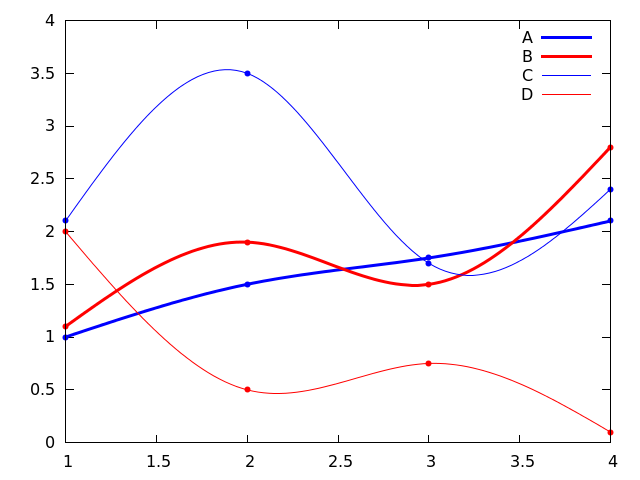
针对Miguel的评论,一个更完整的用例示例是:
filenames = "A B C D"

set linetype 1 lc rgb "blue"        lw 3 pt 7
set linetype 2 lc rgb "red"         lw 3 pt 7
set linetype 3 lc rgb "blue"        lw 1 pt 7
set linetype 4 lc rgb "red"         lw 1 pt 7
set linetype cycle 4

plot for [file in filenames] file.".csv" \
     using 1:2
     title file \
     smooth csplines, \
     for [file in filenames] file.".csv" \
     u 1:2 with points notitle
行类型5-8由循环设置,并由绘图命令的最后部分使用。欢迎对另一种方法提出建议!
回答 2
Stack Overflow用户
发布于 2014-10-28 17:00:58
对于您非常具体的情况,您可以设置更多的样式,并且可以使用do for循环(重用代码)来自动完成此操作:
filenames = "A B C D"

do for [i=0:1] {
set linetype (4*i+1) lc rgb "blue"        lw (i == 1 ? 0 : 3) pt 7
set linetype (4*i+2) lc rgb "red"         lw (i == 1 ? 0 : 3) pt 7
set linetype (4*i+3) lc rgb "blue"        lw (i == 1 ? 0 : 1) pt 7
set linetype (4*i+4) lc rgb "red"         lw (i == 1 ? 0 : 1) pt 7
}
set linetype cycle 8

plot for [file in filenames] file.".csv" \
     using 1:2 \
     title file \
     smooth csplines, \
     for [file in filenames] file.".csv" \
     u 1:2 with points notitle
使用一些简单的数据文件:
Stack Overflow用户
发布于 2014-10-28 16:48:05
对于某些终端,填充点类型的大小取决于线宽,因为它们有一个边框。所有基于cairo的终端(pdfcairo、pngcairo、wxt和cairo胶乳)都是如此,而其他终端,如svg、postscript、qt则没有显示这种行为。
作为测试用例考虑
set linetype 1 lc rgb "red" lw 3 pt 7
set linetype 3 lc rgb "red" lw 1 pt 7

set samples 11
set style function linespoints
plot x lt 1, x + 0.5 lt 3
考虑到您想要图例中的线点样本,最好的选择是将线宽较大的行类型的点大小稍微缩小一点,例如
set linetype 1 lc rgb "red" lw 3 pt 7 ps 0.9缩放因子的选择必须手动确定。
https://stackoverflow.com/questions/26610054
复制相似问题
腾讯云开发者

Copyright © 2013 - 2026 Tencent Cloud. All Rights Reserved. 腾讯云 版权所有
深圳市腾讯计算机系统有限公司 ICP备案/许可证号:粤B2-20090059 ![]() 粤公网安备44030502008569号
粤公网安备44030502008569号
腾讯云计算(北京)有限责任公司 京ICP证150476号 | 京ICP备11018762号