
带有角的高图,去掉xAxis线
带有角的高图,去掉xAxis线
提问于 2014-10-24 06:56:37
我使用的是高级图表,我做了一个名为sparkLine的指令,这是它的代码:
chartModule.directive('sparkLine', function () {
return {
    restrict: 'E',
    scope: {
        series: '=',
        lineName: '=',
        lineTooltip: '=',
        xAxisEnabled: '=',
        yAxisEnabled: '=',
        lineColor: '='
    },
    replace: true,
    template: '<div></div>',

    link: function (scope, element, attrs) {

        var xEnable = (typeof (attrs.xAxisEnabled) == 'undefined') ? false : true;
        var yEnable = (typeof (attrs.yAxisEnabled) == 'undefined') ? false : true;
        var lColor = (typeof (attrs.lineColor) == 'undefined') ? '#808080' : lineColor;

        $(element).highcharts({
            chart:
            {
                type: 'line',
                width: attrs.width,
                height: attrs.height,
                backgroundColor: attrs.backgroundColor
            },
            title: {
                text: ''
            },
            plotOptions: {
                series: {
                    marker: {
                        radius: (typeof (attrs.pointRadius) == 'undefined') ? 2 : attrs.pointRadius,
                    }
                }
            },
            navigation: {
                buttonOptions: {
                    enabled: false
                }
            },
            credits: {
                enabled: false
            },

            xAxis: {
                lineColor: 'transparent',
                tickWidth: 0,
                lineHeight: 0,
                labels: {
                    enabled: xEnable
                },
                categories: []
            },
            yAxis: {
                lineColor: 'transparent',
                gridLineColor: 'trasparent',
                title: {
                    text: ''
                },
                labels: {
                    enabled: yEnable
                },
                plotLines: [{
                    value: 0,
                    width: 1,
                    color: lColor
                }]
            },
            tooltip: {
                formatter:
                    function () {
                        return scope.lineTooltip(this.x, scope.lineName, this.y.toLocaleString());
                    },
                hideDelay: 50
            },
            legend: {
                enabled: false
            },
            series: [{
                name: '',
                data: []
            }]
        });

        scope.$watch('series', function () {
            var chart = $(element).highcharts();
            scope.newperiodsTrends = [];
            scope.categoriesPeriods = [];
            angular.forEach(scope.series, function (elm, index) {
                scope.newperiodsTrends.push(elm.Value);
                scope.categoriesPeriods.push(elm.IterationName);
            });

            chart.series[0].setData(scope.newperiodsTrends);
            chart.xAxis[0].setCategories(scope.categoriesPeriods);
        });
    }
}
});
在我的代码中,这个指令的用法是:
<spark-line series="dataSeries" line-tooltip="tooltip" line-name="'Value'" class="sparkLine">在我的html代码中,我使用angularjs,并使用ng-重复创建了一个表:
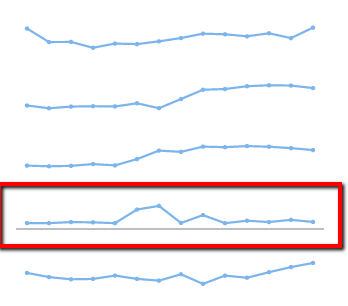
我的问题是,我不能从其中一个图中删除xAxis。
编辑:我发现了一个问题:当我删除包含在css文件中的高度和宽度(class = "sparkLine")时,行被删除了,这可能是一个高图表故障.如果有解决办法的话,我很想听听。谢谢。
回答 1
页面原文内容由Stack Overflow提供。腾讯云小微IT领域专用引擎提供翻译支持
原文链接:
https://stackoverflow.com/questions/26542939
复制相关文章
相似问题
腾讯云开发者

Copyright © 2013 - 2026 Tencent Cloud. All Rights Reserved. 腾讯云 版权所有
深圳市腾讯计算机系统有限公司 ICP备案/许可证号:粤B2-20090059  粤公网安备44030502008569号
腾讯云计算(北京)有限责任公司 京ICP证150476号 | 京ICP备11018762号