
semPaths {semPlot}中的排除节点
我想和R画一条缝路。
我使用semPaths {semPLot}从Mplus中提取的OUT文件。
很明显,它似乎起作用了,但我想删除一些潜在的变量,但我不知道怎么做。
我使用以下语法:
走出Mplus:https://www.dropbox.com/s/vo3oa5fqp7wydlg/questedMOD2.out?dl=0
outfile1 <- "questedMOD.out"semPaths(outfile1,what="est",intercepts=FALSE,rotation=4,edge.color="black",sizeMan=5,esize=TRUE,structural="TRUE",layout="tree2",nCharNodes=0,intStyle="multi“)
回答 2
Stack Overflow用户
发布于 2014-10-27 17:25:26
可能有一种更简单的方法来做到这一点(如果这样做是明智的,就忽略它)--您可以这样做的一种方法是在绘图之前从对象中删除节点。
使用问题Rotate Edges in semPaths/qgraph中的Mplus示例
library(qgraph)
library(semPlot)
library(MplusAutomation)
# This downloads an output file from Mplus examples
download.file("http://www.statmodel.com/usersguide/chap5/ex5.8.out",
outfile <- tempfile(fileext = ".out"))
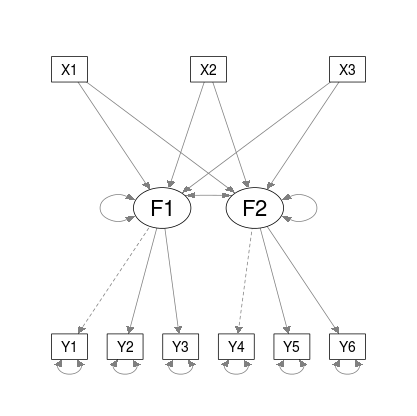
# Unadjusted plot
s <- semPaths(outfile, intercepts = FALSE)
在上面对semPaths的调用中,outfile属于character类,所以行(semPaths的代码开始附近)
 if (!"semPlotModel" %in% class(object))
object <- do.call(semPlotModel, c(list(object), modelOpts)) 从semPlot:::semPlotModel.mplus.model(outfile)返回对象。这是"semPlotModel"类的。
因此,我们的想法是首先创建这个对象,修改它,然后将这个对象传递给semPaths。
# Call semPlotModel on your Mplus file
obj <- semPlot:::semPlotModel.mplus.model(outfile)
# obj <- do.call(semPlotModel, list(outfile)) # this is more general / not just for Mplus
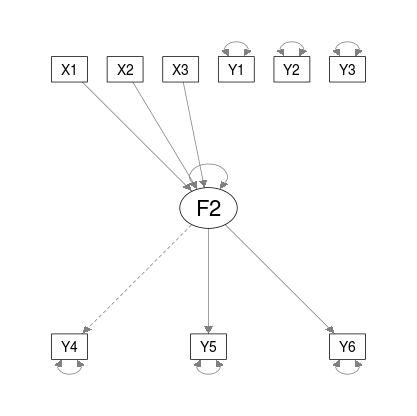
# Remove one factor (F1) from object@Pars - need to check lhs and rhs columns
idx <- apply(obj@Pars[c("lhs", "rhs")], 1, function(i) any(grepl("F1", i)))
obj@Pars <- obj@Pars[!idx, ]
class(obj)obj现在属于"semPlotModel"类,可以直接传递给semPaths
s <- semPaths(obj, intercepts = FALSE)
可以使用str(s)查看此返回对象的结构。
Stack Overflow用户
发布于 2022-05-26 08:46:23
假设您使用下面的半路径代码打印SEM
semPaths(obj, intercepts = FALSE)%>%
   plot()
您可以使用以下函数删除任何节点的标签:
remove_nodes_and_edges <- function(semPaths_obj,node_tbrm_vec){

   relevent_nodes_index <- semPaths_obj$graphAttributes$Nodes$names %in% node_tbrm_vec

   semPaths_obj$graphAttributes$Nodes$width[relevent_nodes_index]=0

   semPaths_obj$graphAttributes$Nodes$height[relevent_nodes_index]=0

   semPaths_obj$graphAttributes$Nodes$labels[relevent_nodes_index]=""

   return(semPaths_obj)

}
并以下列方式在绘图管道中使用此函数
semPaths(obj, intercepts = FALSE) %>%
   remove_nodes_and_edges(c("Y1","Y2","Y3")) %>%
plot()https://stackoverflow.com/questions/26214531
复制相似问题
腾讯云开发者

Copyright © 2013 - 2026 Tencent Cloud. All Rights Reserved. 腾讯云 版权所有
深圳市腾讯计算机系统有限公司 ICP备案/许可证号:粤B2-20090059 ![]() 粤公网安备44030502008569号
粤公网安备44030502008569号
腾讯云计算(北京)有限责任公司 京ICP证150476号 | 京ICP备11018762号