
Gnuplot (Y)平滑
Gnuplot (Y)平滑
提问于 2014-09-30 16:39:42
如何平滑以x(y)形式表示的数据?图形平滑函数对无效处理这样的情况。
例如:
档案(T-L.dat):
0.00    0.0
0.10    0.1
0.15    0.2
0.40    0.3
0.60    0.4
0.50    0.5
0.60    0.6
0.40    0.7
0.15    0.8
0.10    0.9
0.00 1.0我想要的。
Gnuplot会话:
knkd@SCP71:~/MEAS/HEAT$ gnuplot

        G N U P L O T
        Version 4.6 patchlevel 4    last modified 2013-10-02
        Build System: Linux x86_64

        Copyright (C) 1986-1993, 1998, 2004, 2007-2013
        Thomas Williams, Colin Kelley and many others

        gnuplot home:     http://www.gnuplot.info
        faq, bugs, etc:   type "help FAQ"
        immediate help:   type "help"  (plot window: hit 'h')

Terminal type set to 'wxt'
gnuplot> plot "T-L.dat" with lines添加平滑:
gnuplot> plot "T-L.dat" with lines smooth csplines结果也不好(只有2个链接,对不起)。
其他特性也没有给出我想要的结果。但我真的需要一条样条。
回答 1
Stack Overflow用户
回答已采纳
发布于 2014-09-30 20:56:51
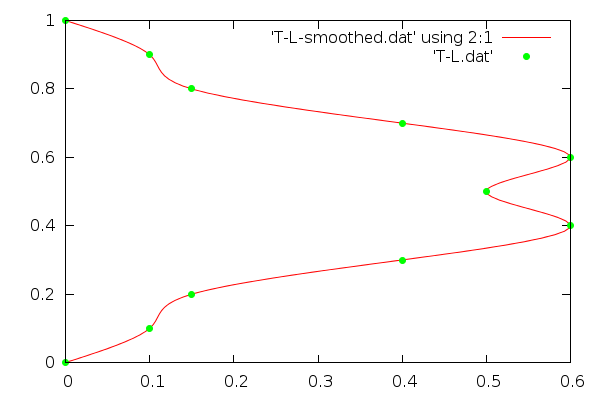
正确,用样条图可以平滑只使用表格y(x)的数据。为此,在平滑数据之前,数据在x中是单调的。你的数据相对于y是对称的,这就是为什么你得到一条直线作为平滑的结果。
为了平滑有关y的数据,必须首先交换轴并将平滑结果保存到临时文件中。然后用正确的轴选择绘制此图:
set table 'T-L-smoothed.dat'
plot 'T-L.dat' using 2:1 smooth csplines
unset table
plot 'T-L-smoothed.dat' using 2:1 with lines, 'T-L.dat' with points pt 7
页面原文内容由Stack Overflow提供。腾讯云小微IT领域专用引擎提供翻译支持
原文链接:
https://stackoverflow.com/questions/26125886
复制相关文章
相似问题
腾讯云开发者

Copyright © 2013 - 2026 Tencent Cloud. All Rights Reserved. 腾讯云 版权所有
深圳市腾讯计算机系统有限公司 ICP备案/许可证号:粤B2-20090059 ![]() 粤公网安备44030502008569号
粤公网安备44030502008569号
腾讯云计算(北京)有限责任公司 京ICP证150476号 | 京ICP备11018762号