
从one图中提取一个方面
我有两个地块,每个都显示了不同类型的数据(疫苗和疾病),我想提取这些地块的片段来生成每个主题的一个地块,它同时具有疫苗和疾病,根据最初的地块着色。
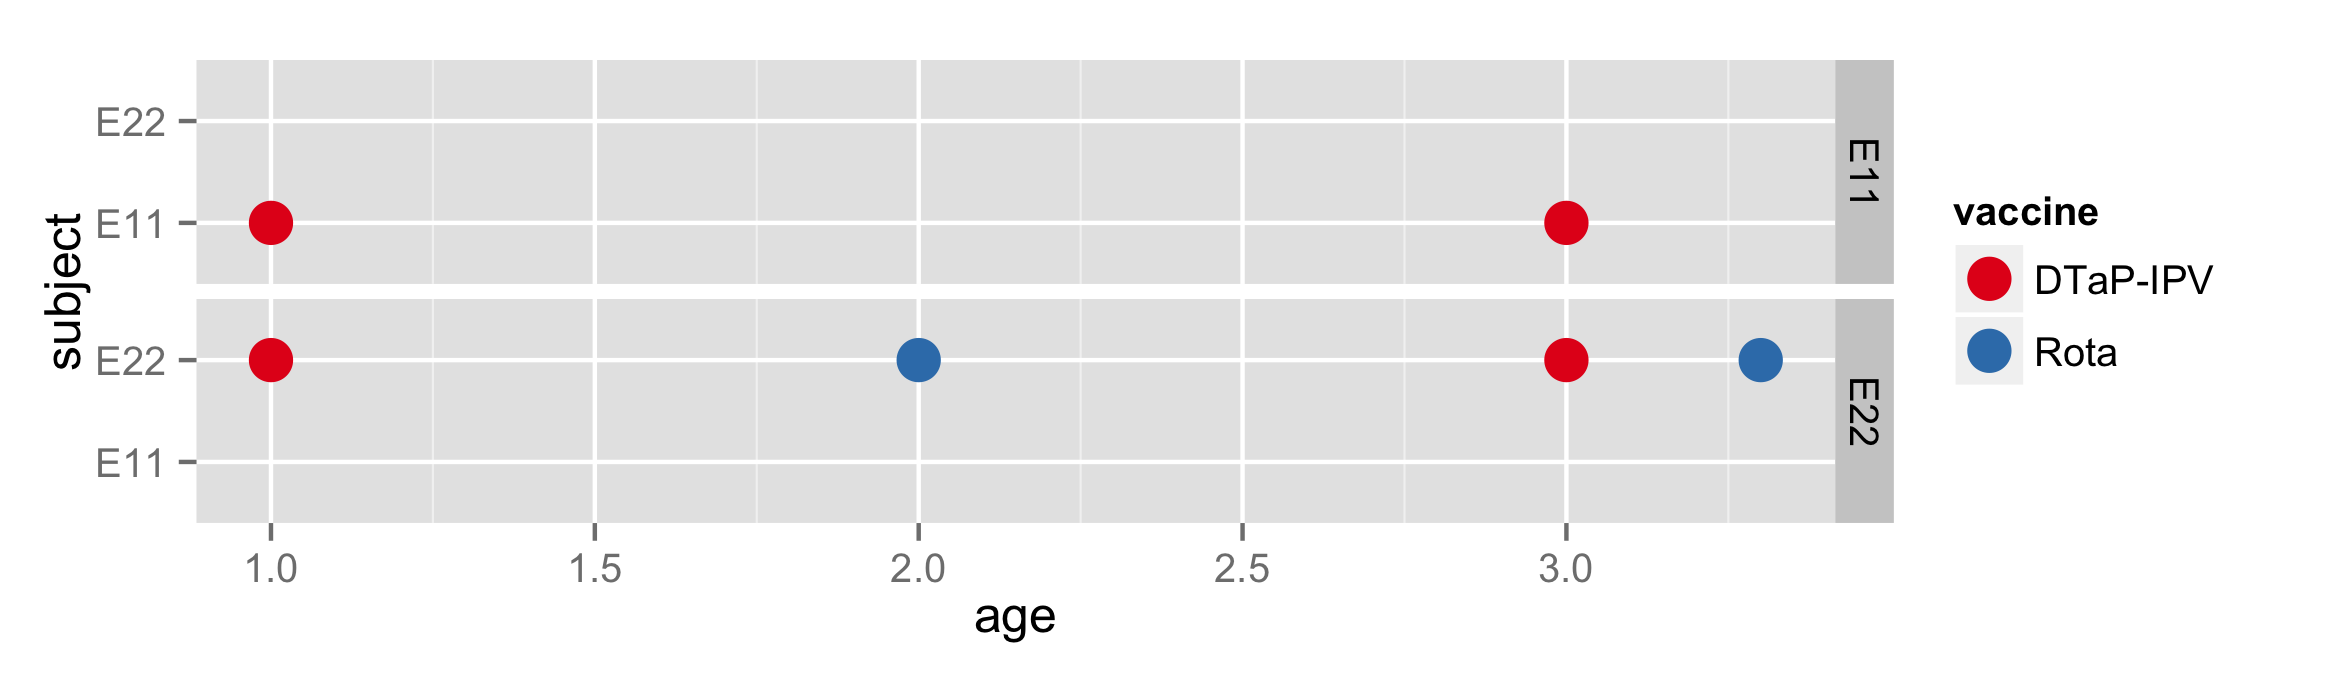
vac
subject age vaccine
1 E11 1.0 DTaP-IPV
2 E11 3.0 DTaP-IPV
3 E22 1.0 DTaP-IPV
4 E22 2.0 Rota
5 E22 3.0 DTaP-IPV
6 E22 3.3 Rota
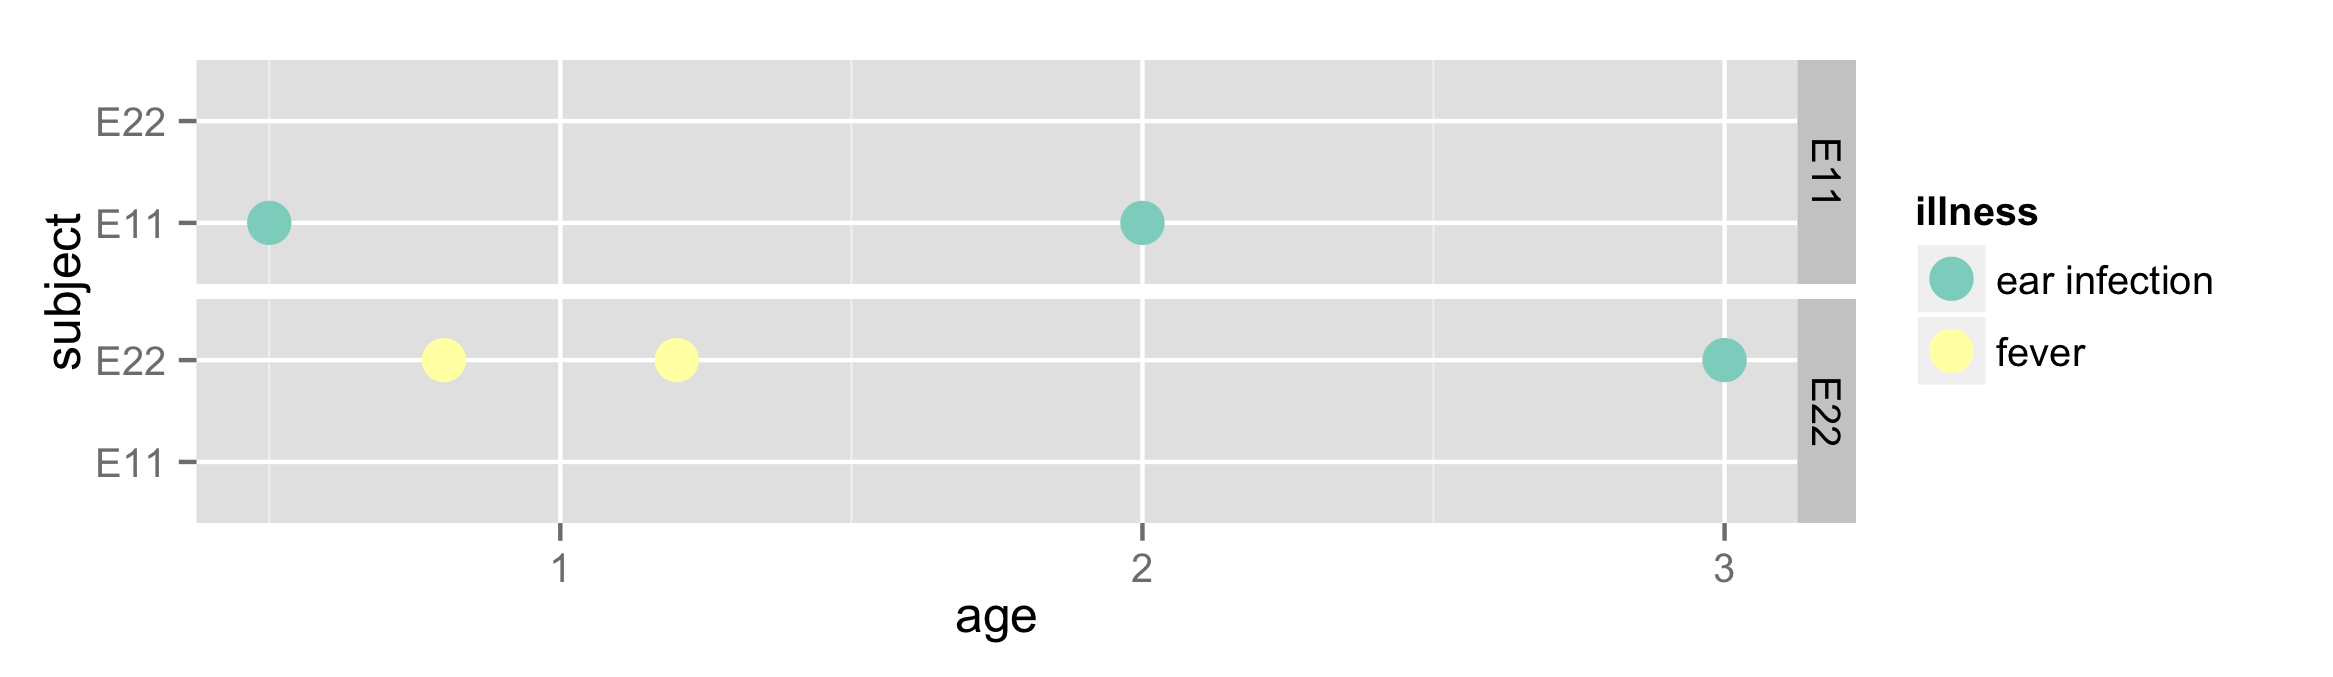
ill
subject age illness
1 E11 0.5 ear infection
2 E11 2.0 ear infection
3 E22 0.8 fever
4 E22 1.2 fever
5 E22 3.0 ear infection
ggplot(vac,aes(x=age,y=subject,color=vaccine))+geom_point(size=5) +
scale_color_brewer(palette="Set1",drop = FALSE)+facet_grid(subject~.)
ggplot(ill,aes(x=age,y=subject,color=illness))+geom_point(size=5) +
  scale_color_brewer(palette="Set3",drop = FALSE)+facet_grid(subject~.)
现在,我希望有一个用于E11的图形,它有一行疫苗(用Set1颜色表示),一行疾病(用Set3颜色表示),而对于E22则是一样的。
我有许多数据类型,和~40科目,所以,当然,我希望这是自动完成,而不是通过插画,等等。
我认为gtable是方法,但不知道如何提取一个方面。
非常感谢!
回答 3
Stack Overflow用户
发布于 2014-09-29 16:50:33
这里有一个快速的解决方案,可以帮助你朝着正确的方向前进。试试看。
require(reshape2)
require(plyr)
dat <- melt(join(vac, ill, type="full"), id.vars = c("subject", "age"), na.rm=TRUE)

ggplot(dat, aes(x=age,y=variable, color=value))+geom_point(size=5) +
scale_color_brewer(palette="Set1",drop = FALSE)+facet_grid(subject~.)Stack Overflow用户
发布于 2014-09-29 18:06:05
下面的代码将vac和ill合并在一个单一的数据框架中(添加一个新的变量type来区分疫苗和疾病),这将使我们能够在调用ggplot时同时绘制疾病和疫苗。代码有点笨重,但我希望它能让你更接近你想要的东西。
library(RColorBrewer)
library(gridExtra)

# Combine data frames vac and ill by adding a new column
# called "type" and changing name of the third column to "condition"
vac$type = "Vaccine"
names(vac)[3] = "condition"

ill$type = "Illness"
names(ill)[3] = "condition"

dat = rbind(vac, ill)

# Convert condition to a factor to get the levels ordered properly
dat$condition = factor(dat$condition,
                       levels=c(unique(dat$condition[dat$type=="Vaccine"]),
                                unique(dat$condition[dat$type=="Illness"])))

dat
   subject age     condition    type
1      E11 0.5 ear infection Illness
2      E11 2.0 ear infection Illness
3      E22 3.0 ear infection Illness
4      E22 0.8         fever Illness
5      E22 1.2         fever Illness
6      E11 1.0      DTaP-IPV Vaccine
7      E11 3.0      DTaP-IPV Vaccine
8      E22 1.0      DTaP-IPV Vaccine
9      E22 3.0      DTaP-IPV Vaccine
10     E22 2.0          Rota Vaccine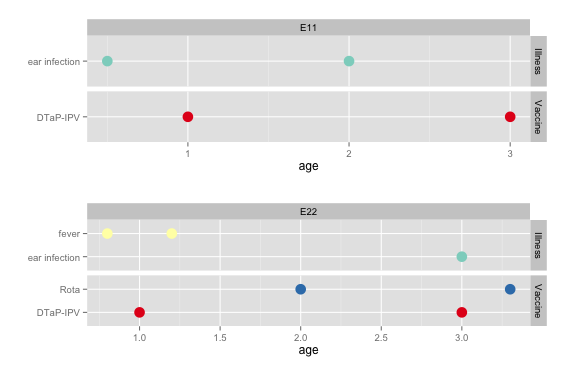
11 E22 3.3 Rota Vaccine现在,我们为每个主题生成一个图,将每个图放在一个列表中,然后将所有图保存到一个PDF文件中。ggplot代码的工作方式如下:
subject的方面,这样我们就可以得到一个带有主题ID的条条。- 由
type提供的Facet,这样我们就可以得到疾病和疫苗的独立图表。 - 使用下面创建的调色板获取我们想要的颜色
pal1 = c(brewer.pal(n=3, name="Set1")[1:2], brewer.pal(n=3, name="Set3")[1:2])
p = list()
for (i in unique(dat$subject)) {
  p[[i]] = ggplot(dat[dat$subject==i,],
                  aes(x=age, y=condition, colour=condition)) +
    geom_point(size=5) +
    scale_color_manual(values=pal1, drop=FALSE) +
    facet_grid(type ~ subject, scale="free") + ylab("") +
   guides(colour=FALSE)
}

pdf("plots.pdf", 9,5)
do.call("grid.arrange", p)
dev.off()
这是图表:
Stack Overflow用户
发布于 2014-09-29 18:06:18
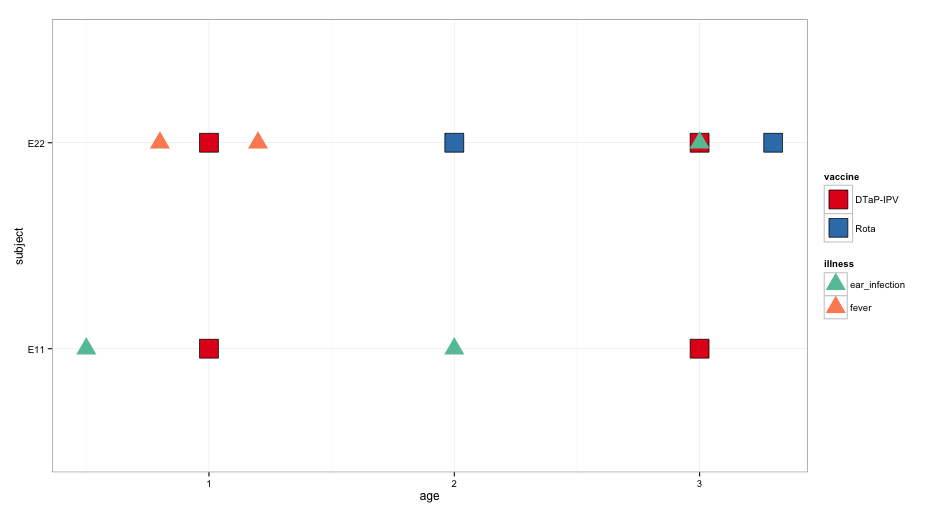
在您在问题中创建的方面中,对于主题(而不是在面中),您有空行。有了40个主题,这将创建一个填充行和39个空行的方面,这可能不是您想要的。
另一种解决办法:
# merging the dataframes together
dat <- merge(vac, ill, by=c("subject","age"), all=TRUE, sort=TRUE)

# creating the plot
ggplot() +
  geom_point(data=dat[!is.na(dat$vaccine),], aes(x=age, y=subject, fill=vaccine), size=10, shape=22) +
  geom_point(data=dat[!is.na(dat$illness),], aes(x=age, y=subject, color=illness), size=7, shape=17) +
  scale_fill_brewer(palette="Set1") +
  scale_color_brewer(palette="Set2") +
  theme_bw()
这意味着:
https://stackoverflow.com/questions/26104493
复制相似问题
腾讯云开发者

Copyright © 2013 - 2026 Tencent Cloud. All Rights Reserved. 腾讯云 版权所有
深圳市腾讯计算机系统有限公司 ICP备案/许可证号:粤B2-20090059 ![]() 粤公网安备44030502008569号
粤公网安备44030502008569号
腾讯云计算(北京)有限责任公司 京ICP证150476号 | 京ICP备11018762号