
自举模态+ Morris.js图
自举模态+ Morris.js图
提问于 2014-09-16 20:44:17
我有一些问题,得到一个morris.js图表,以显示在一个引导模式正确。不仅尺寸缩小了,图表也没有画出来。我已经到处找过了,到目前为止还没有找到适合我的解决方案。有人能帮忙吗?
编辑:解决了调整大小的问题,但它仍然没有绘制图表。谢谢!
模态标记:
<div class="modal fade" id="clusterpulse" tabindex="-1" role="dialog" aria-labelledby="clusterpulse" aria-hidden="true">
<div class="modal-dialog">
<div class="modal-content">
<div class="modal-header">
<button type="button" class="close" data-dismiss="modal" aria-hidden="true">×</button>
<h4 class="modal-title" id="myModalLabel">Pulse</h4>
</div>
<div class="modal-body">
<div class="col-lg-4">
<div class="panel panel-primary">
<div class="panel-heading">
<h3 class="panel-title"><i class="fa fa-long-arrow-right"></i>Versions by Environment</h3>
</div>
<div class="panel-body">
<div id="morris-chart-versions"></div>
</div><!-- /.panel-body -->
</div><!-- /.panel-primary -->
</div><!-- /.col-lg-4 -->
</div><!-- /.modal-body -->
</div><!-- /.modal-content -->
</div><!-- /.modal-dialog -->
</div> <!-- /.modal -->联署材料:
<script>
$(function () {
// Create a Bar Chart with Morris
var chart = Morris.Bar({
element: 'morris-chart-versions',
data: [0, 0], // Set initial data (ideally you would provide an array of default data)
xkey: 'd', // Set the key for X-axis
ykeys: ['test1','test2','test3'], // Set the key for Y-axis
labels: ['test1','test2','test3'], // Set the label when bar is rolled over
resize: true
stacked: true
});
// Fire off an AJAX request to load the data
$.ajax({
type: "GET",
dataType: 'json',
url: "../scripts/all_versions.php", // This is the URL to the API
})
.done(function (data) {
// When the response to the AJAX request comes back render the chart with new data
chart.setData(data);
})
.fail(function () {
// If there is no communication between the server, show an error
alert("error occured");
});
});
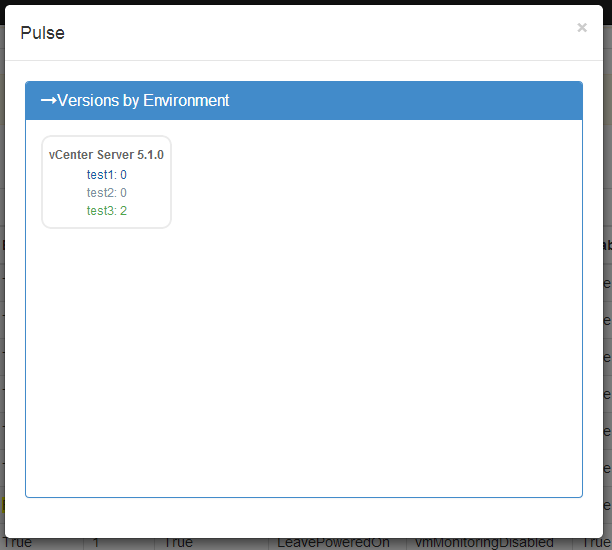
</script>这就是它最终的样子:
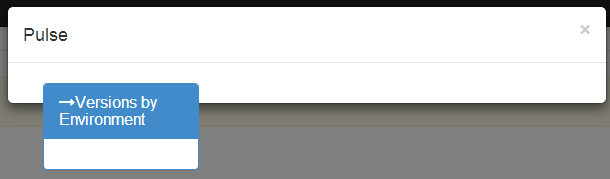
编辑:我发现了调整大小的问题。这是我的标记中的“col 4”。从主页上的另一张图上把它留在那里。现在看起来是这样的:
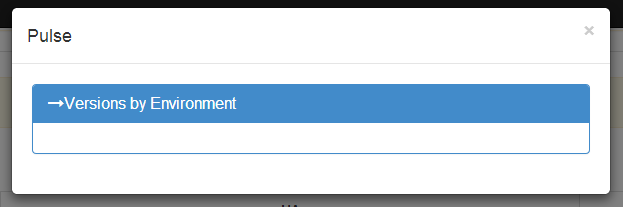
Edit2:当我从js中删除“resize:true”时。
回答 3
Stack Overflow用户
回答已采纳
发布于 2014-09-16 23:10:02
这里是js,它最终允许我将一个图形放在一个模式中,然后在单击时重新绘制。
<script>
$('#clusterpulse').on('shown.bs.modal', function () { //listen for user to open modal
    $(function () {
    $( "#morris-chart-versions" ).empty(); //clear chart so it doesn't create multiple if multiple clicks
        // Create a Bar Chart with Morris
        var chart = Morris.Bar({
            element: 'morris-chart-versions',
            data: [0, 0], // Set initial data (ideally you would provide an array of default data)
            xkey: 'd', // Set the key for X-axis
            ykeys: ['test1','test2','test3'], // Set the key for Y-axis
            labels: ['test1','test2','test3'], // Set the label when bar is rolled over
            stacked: true
        });

        // Fire off an AJAX request to load the data
        $.ajax({
            type: "GET",
            dataType: 'json',
            url: "../scripts/all_versions.php", // This is the URL to the API

        })
            .done(function (data) {
                // When the response to the AJAX request comes back render the chart with new data
                chart.setData(data);
            })
            .fail(function () {
                // If there is no communication between the server, show an error
                alert("error occured");
           });
        });
        });
</script>Stack Overflow用户
发布于 2014-09-16 22:24:06
我看到你的问题了。这是你如何形成你的数据,图表无法理解它。
下面是我用过的一个例子:
  var data = [];
  var mult = 200;
  for(var i = 0; i < 40; i++){
             data.push({y: 1300+(i*mult), value: 30*i});
  }
这是我的图表参数
  Morris.Line({
       // ID of the element in which to draw the chart.
       element: 'linechart',
       // Chart data records -- each entry in this array corresponds to a point on
       // the chart.
       data: data,
       // The name of the data record attribute that contains x-visitss.
       xkey: 'y',
       // A list of names of data record attributes that contain y-visitss.
       ykeys: ['value'],
       // Labels for the ykeys -- will be displayed when you hover over the
       // chart.
       labels: ['y'],
       // Disables line smoothing
       smooth: false,
           parseTime: false,
     });
因为重绘似乎不起作用,所以我在选项卡上重新绘制时所做的事情:
   $('ul.nav a').on('shown.bs.tab', function(e){
    // this ain't pretty, but you should get the idea
    if ($(e.target).attr('href') == '#AMD' && $('#line2').html().length == 0) {
     Morris.Area({
       element: 'line2',
       data: chartdata,
       xkey: 'd',
       ykeys: ['visits'],
       labels: ['USD'],
       // Disables line smoothing
       smooth: false,
     });
        $(document).scrollTop( $("#myTab").offset().top );
    }
    if ($(e.target).attr('href') == '#TTWO' && $('#line3').html().length == 0) {
     Morris.Area({
       element: 'line3',
       data: data,
       xkey: 'd',
       ykeys: ['visits'],
       labels: ['USD'],
       smooth: false,
     });
        $(document).scrollTop( $("#myTab").offset().top );
    }
});
这是一个旧版本的代码,但你应该有这个想法。这里的关键部分是:
    $('ul.nav a').on('shown.bs.tab', function(e){
       if ($(e.target).attr('href') ==
我认为它可以应用于情态
Stack Overflow用户
发布于 2015-07-18 18:10:53
您可以延迟绘制graph.Following方法给我的解决方案。
setTimeout( function(){
     Morris.Area({...})
},1200);您可以根据您的图形和数据集更改1200。
页面原文内容由Stack Overflow提供。腾讯云小微IT领域专用引擎提供翻译支持
原文链接:
https://stackoverflow.com/questions/25878104
复制相关文章
相似问题
腾讯云开发者

Copyright © 2013 - 2026 Tencent Cloud. All Rights Reserved. 腾讯云 版权所有
深圳市腾讯计算机系统有限公司 ICP备案/许可证号:粤B2-20090059 ![]() 粤公网安备44030502008569号
粤公网安备44030502008569号
腾讯云计算(北京)有限责任公司 京ICP证150476号 | 京ICP备11018762号