
如何排除熊猫科学-学习多维缩放永远运行
编辑看起来不一定是第64行中的数据问题。相反,数字64本身是神奇的,并导致问题。当我继续解决这个问题时,我编写了一个脚本,从DataFrame中随机抓取63行连续行并绘制它们。每次都跑得很快。但是,如果我将它更改为64行,它永远不会工作和运行。端编辑
我试图使用多维缩放来可视化集群中的数据。我创建了一个DataFrame,它的维数为1000行和1964列。当我试图对数据执行多维缩放时,这个过程将永远运行。奇怪的是,我似乎不能通过做一个ctrl+c来结束这个过程。
通过一个反复试验的过程,我发现了数据集第64行的神奇之处。如果我在63行上运行这个过程,那么整个过程将在几秒钟内完成。但是,如果我把它提高到64行,它就永远不会结束。
我真的不知道该如何解决这个问题。我翻阅了1964年的专栏,寻找第63行和第64行的不同之处,希望能找到一个奇怪的值或什么东西,但什么也没有从我身上跳出来。还有什么别的方法可以让我知道64行为什么如此神奇?
import pandas as pd
from pandas import DataFrame as df
from sklearn.metrics.pairwise import euclidean_distances
from sklearn.metrics.pairwise import manhattan_distances
from sklearn import manifold
from matplotlib import pyplot as plt
import prettyplotlib as ppl

malware_df = df.from_csv('malware_features.csv')

plottable = malware_df[[c for c in malware_df.columns if c != 'hash']]
plottable = plottable.head(63) # change this to 64 and everything stops working

euc = euclidean_distances(plottable)
mds = manifold.MDS(n_jobs=-1, random_state=1337, dissimilarity='precomputed')
pos_e = mds.fit(euc).embedding_

plottable['xpos'] = pos_e[:,0]
plottable['ypos'] = pos_e[:,1]
with ppl.pretty:
    fig, ax = ppl.subplots(figsize=(6,8))
ppl.scatter(ax, plottable.xpos, plottable.ypos)
plt.show()这里有一个链接,您可以在这里下载我正在使用的文件,如果有帮助的话。https://drive.google.com/file/d/0BxZZOOgLl7vSTUlxc1BmMUFmTVU/edit?usp=sharing
回答 1
Stack Overflow用户
发布于 2014-09-09 22:08:31
这一定是有版本的。在我的计算机(2003年,1台AMD内核,2 Gb RAM)中,这段代码在大约3秒内运行:
#import pandas as pd
from pandas import DataFrame as df
from sklearn.metrics.pairwise import euclidean_distances
#from sklearn.metrics.pairwise import manhattan_distances
from sklearn import manifold
from matplotlib import pyplot as plt
import prettyplotlib as ppl

malware_df = df.from_csv('malware_features.csv')

plottable = malware_df[[c for c in malware_df.columns if c != 'hash']]
plottable = plottable.head(128) # change this to 64 and everything stops working

euc = euclidean_distances(plottable)
mds = manifold.MDS(n_jobs=-1, random_state=1337, dissimilarity='precomputed')
pos_e = mds.fit(euc).embedding_

plottable['xpos'] = pos_e[:,0]
plottable['ypos'] = pos_e[:,1]

fig, ax = ppl.subplots(figsize=(6,8))

ppl.scatter(ax, plottable.xpos, plottable.ypos)
plt.show()
若要制作此图形:
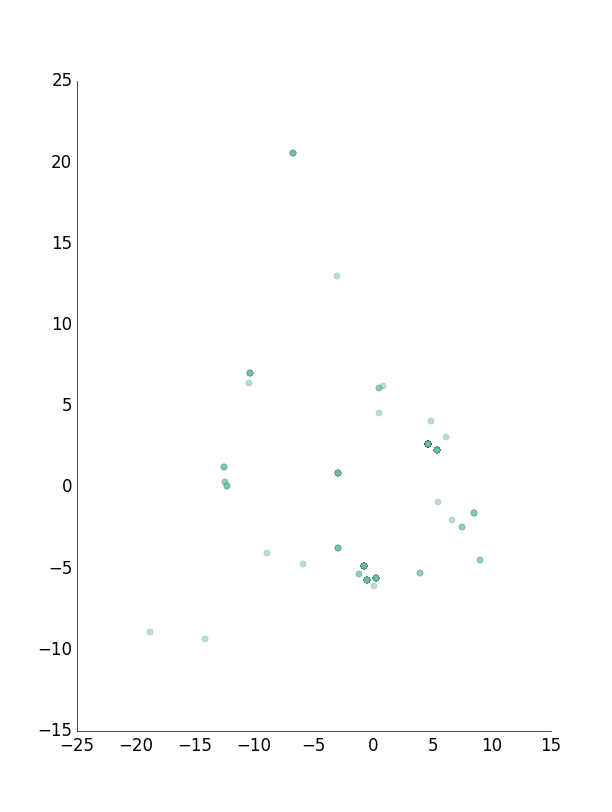
注意,在尝试64之后,我尝试了128,但没有失败,为了查看发生了什么,更改了引发错误的with ppl.pretty,一切都运行良好。这是我的pip freeze
brewer2mpl==1.4
matplotlib==1.4.0
numpy==1.9.0
pandas==0.14.1
prettyplotlib==0.1.7
reportlab==3.1.8
scikit-learn==0.15.2
scipy==0.14.0
和python 2.7.3。
https://stackoverflow.com/questions/25677665
复制相似问题
腾讯云开发者

Copyright © 2013 - 2026 Tencent Cloud. All Rights Reserved. 腾讯云 版权所有
深圳市腾讯计算机系统有限公司 ICP备案/许可证号:粤B2-20090059 ![]() 粤公网安备44030502008569号
粤公网安备44030502008569号
腾讯云计算(北京)有限责任公司 京ICP证150476号 | 京ICP备11018762号