
R图:是否有一种方法可以在文本标签周围绘制边框、阴影或缓冲区?
R图:是否有一种方法可以在文本标签周围绘制边框、阴影或缓冲区?
提问于 2014-09-02 19:48:26
我想在单色的线条上画一个标签。所以我需要标签上每个字母的白色小边框。
文本标签的矩形边框或背景并不有用,因为它隐藏了大量绘制的数据。
有没有办法在R图中的文本标签周围放置边框、阴影或缓冲区?
shadowtext <- function(x, y=NULL, labels, col='white', bg='black',
theta= seq(pi/4, 2*pi, length.out=8), r=0.1, ... ) {
xy <- xy.coords(x,y)
xo <- r*strwidth('x')
yo <- r*strheight('x')
for (i in theta) {
text( xy$x + cos(i)*xo, xy$y + sin(i)*yo, labels, col=bg, ... )
}
text(xy$x, xy$y, labels, col=col, ... )
}
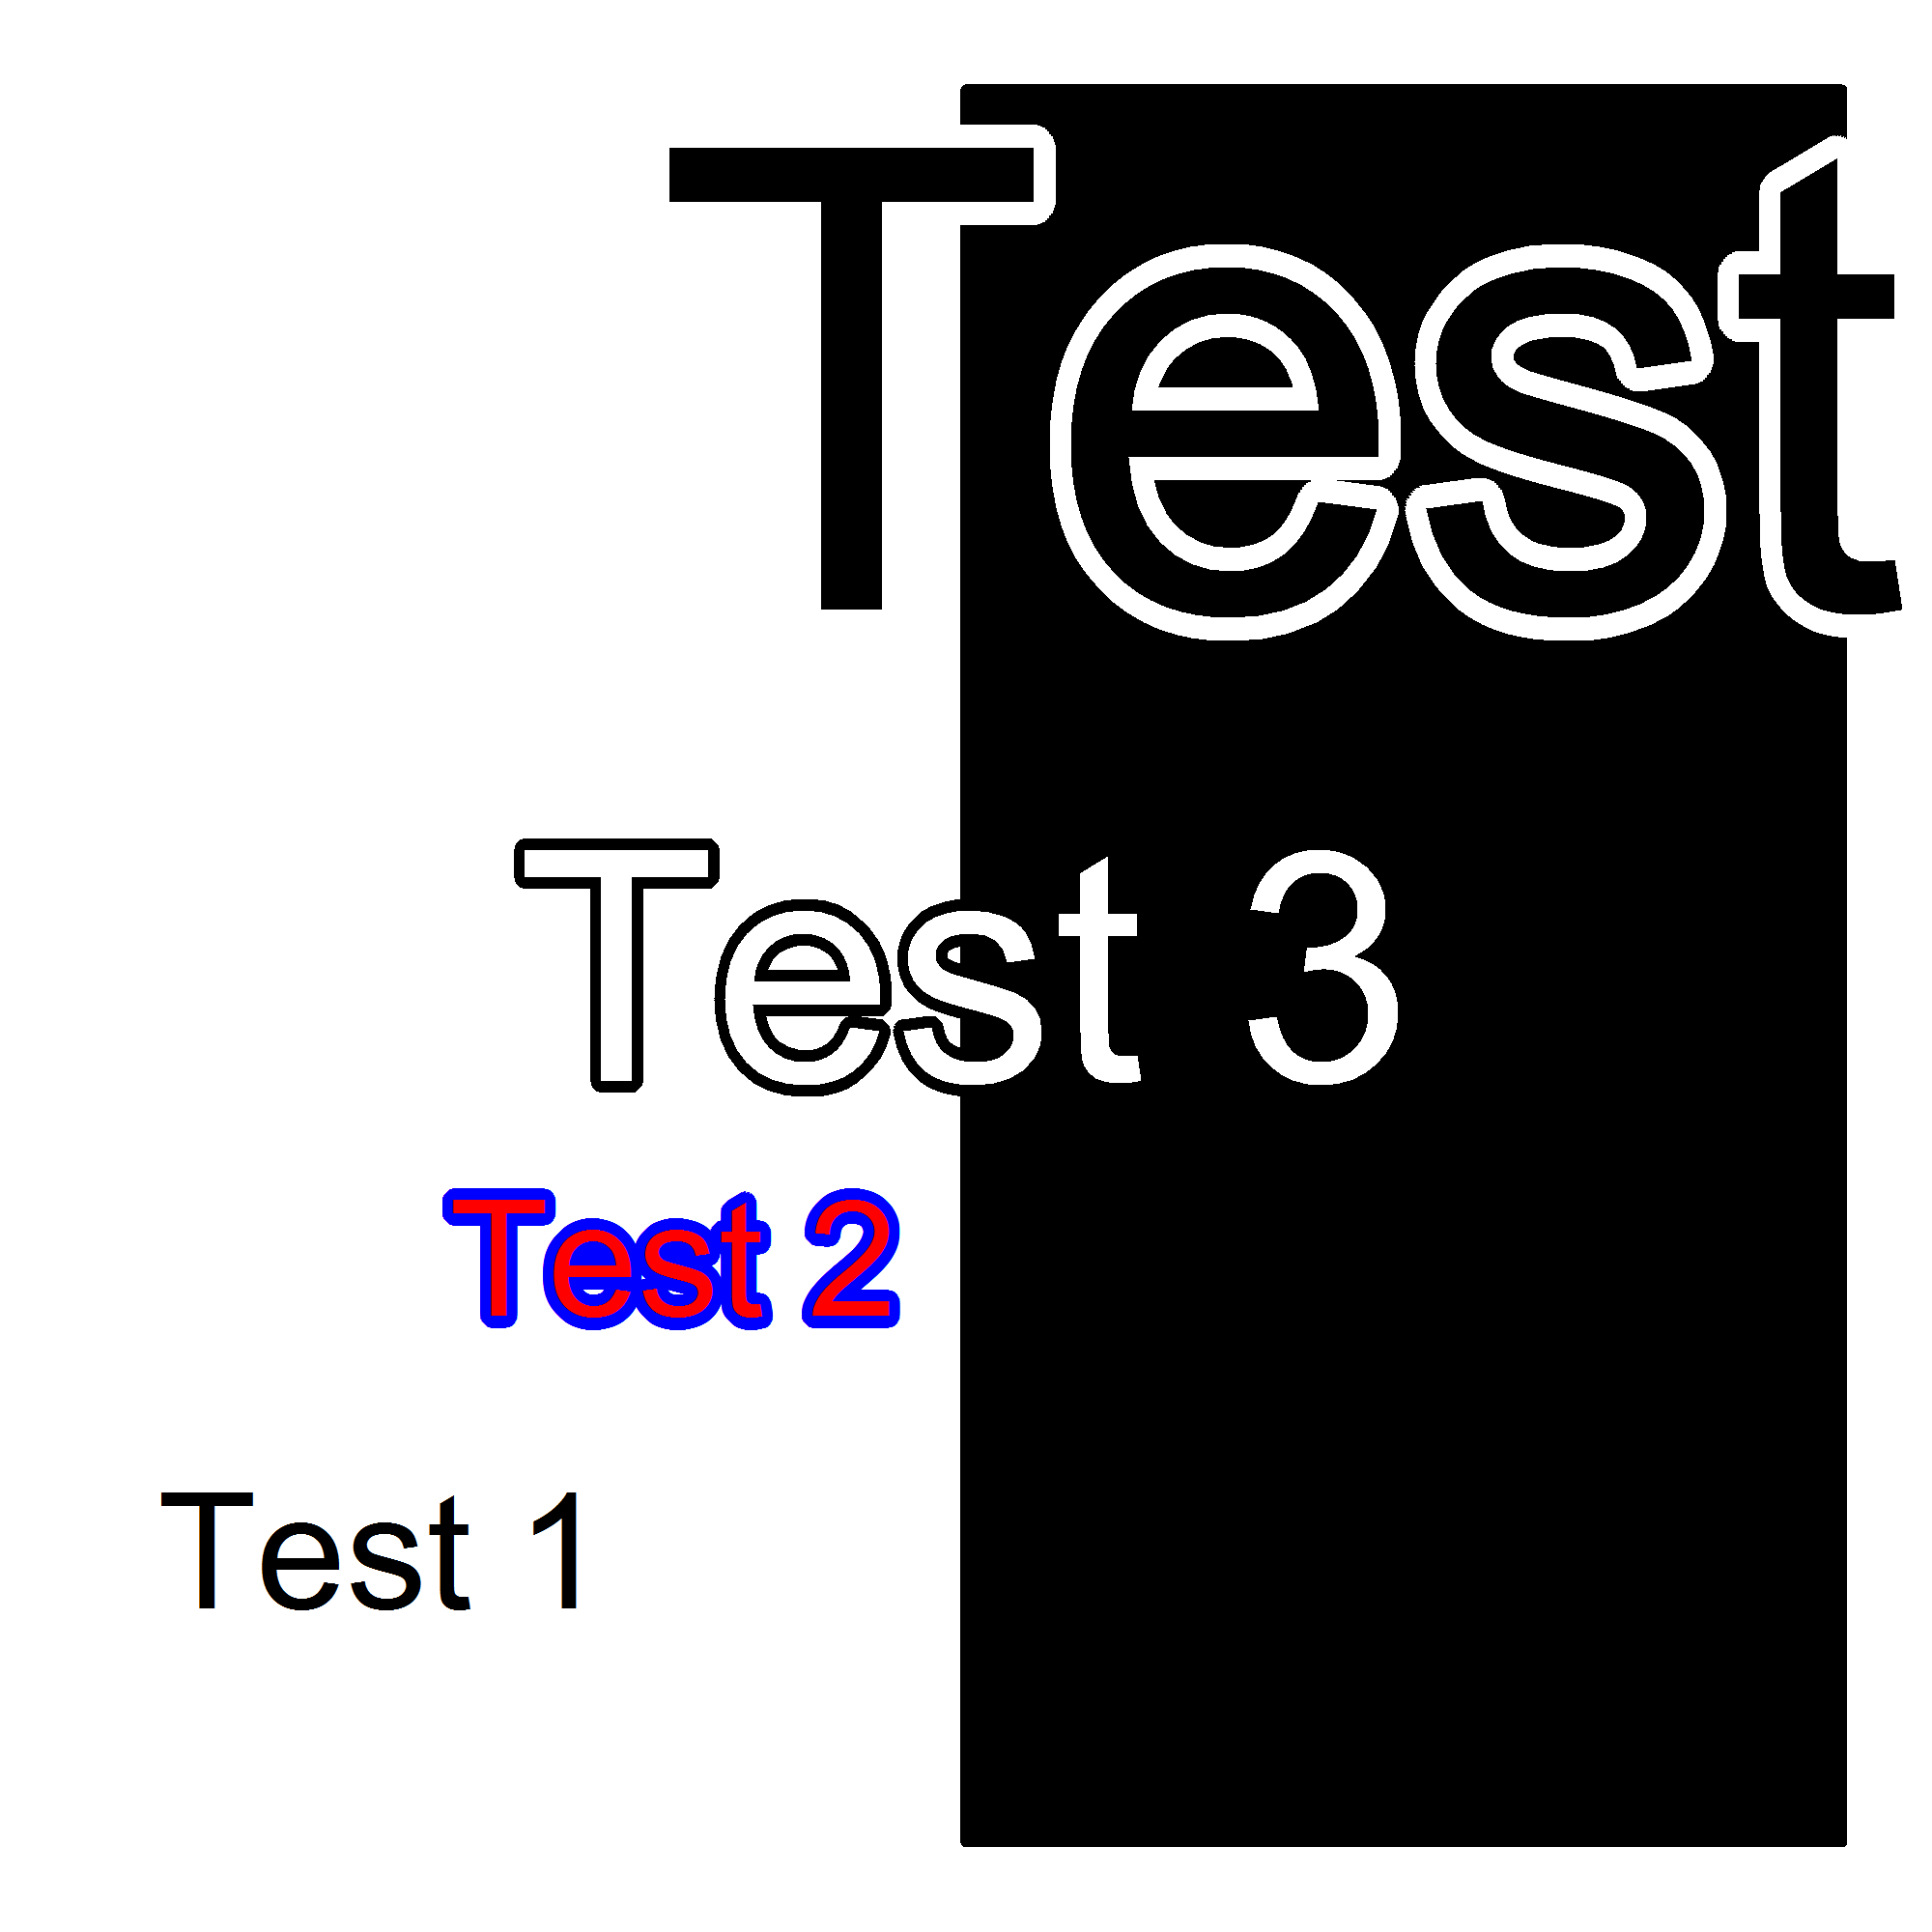
pdf(file="test.pdf", width=2, height=2); par(mar=c(0,0,0,0)+.1)
plot(c(0,1), c(0,1), type="l", lwd=20, axes=FALSE, xlab="", ylab="")
text(1/6, 1/6, "Test 1")
text(2/6, 2/6, "Test 2", col="white")
shadowtext(3/6, 3/6, "Test 3")
shadowtext(4/6, 4/6, "Test 4", col="black", bg="white")
shadowtext(5/6, 5/6, "Test 5", col="black", bg="white", theta = seq(pi/4, 2*pi, length.out=24))
dev.off()上面的代码使用柯肯巴克尔的溶液。这是好的PNG图形,但我需要一个高分辨率PDF不同的方法。
回答 4
Stack Overflow用户
回答已采纳
发布于 2014-09-02 21:15:51
您可以尝试这个‘阴影文本’功能,绘制光环或边框周围的文本,通过打印它的几次与一个轻微的偏移在不同的颜色。所有学分都是格雷格·斯诺的。
shadowtext <- function(x, y=NULL, labels, col='white', bg='black',
                       theta= seq(0, 2*pi, length.out=50), r=0.1, ... ) {

    xy <- xy.coords(x,y)
    xo <- r*strwidth('A')
    yo <- r*strheight('A')

    # draw background text with small shift in x and y in background colour
    for (i in theta) {
        text( xy$x + cos(i)*xo, xy$y + sin(i)*yo, labels, col=bg, ... )
    }
    # draw actual text in exact xy position in foreground colour
    text(xy$x, xy$y, labels, col=col, ... )
}

# And here is an example of use:
# pdf(file="test2.pdf", width=2, height=2); par(mar=c(0,0,0,0)+.1)
plot(c(0,1), c(0,1), type="n", lwd=20, axes=FALSE, xlab="", ylab="")

rect(xleft = 0.5, xright = 1, ybottom = 0, ytop = 1, col=1)
text(1/6, 1/6, "Test 1")
shadowtext(2/6, 2/6, "Test 2", col='red', bg="blue")
shadowtext(3/6, 3/6, "Test 3", cex=2)

# `r` controls the width of the border
shadowtext(5/6, 5/6, "Test 4", col="black", bg="white", cex=4, r=0.2)
# dev.off()
Stack Overflow用户
发布于 2016-08-17 17:29:16
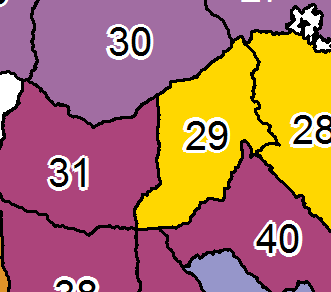
我需要这样做的地图在R,并最终使用“光栅”包,以绘制光环周围的文字标签。
http://rpackages.ianhowson.com/cran/raster/man/text.html
例如,
library(raster)

text(Points, labels = Points$Labels, halo = TRUE, hw = 0.08, hc = "white", cex = 0.8)
# hw = halo width
# hc = halo color
Stack Overflow用户
发布于 2014-10-17 11:57:01
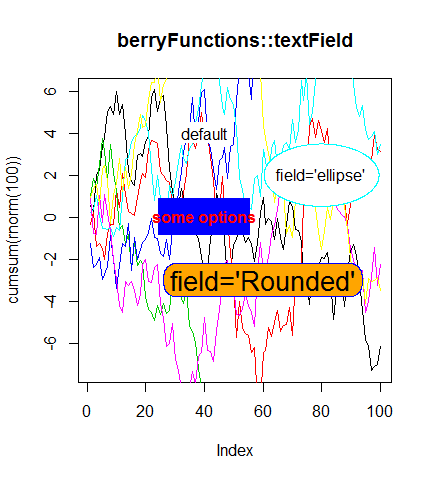
我为文本字段编写了一个类似的函数,该函数也适用于对数比例。
install.packages("berryFunctions")
library("berryFunctions")
?textField
这可以被认为是更好的矢量图形。下面是一些示例:
PS:如果你想做贡献的话:https://github.com/brry/berryFunctions
页面原文内容由Stack Overflow提供。腾讯云小微IT领域专用引擎提供翻译支持
原文链接:
https://stackoverflow.com/questions/25631216
复制相关文章
相似问题
腾讯云开发者

Copyright © 2013 - 2026 Tencent Cloud. All Rights Reserved. 腾讯云 版权所有
深圳市腾讯计算机系统有限公司 ICP备案/许可证号:粤B2-20090059 ![]() 粤公网安备44030502008569号
粤公网安备44030502008569号
腾讯云计算(北京)有限责任公司 京ICP证150476号 | 京ICP备11018762号