
用于绘制ecdf的col/bg
用于绘制ecdf的col/bg
提问于 2014-08-31 13:25:05
我想在一个ecdf图中突出某些点(没有相邻的行)。问题是,要么
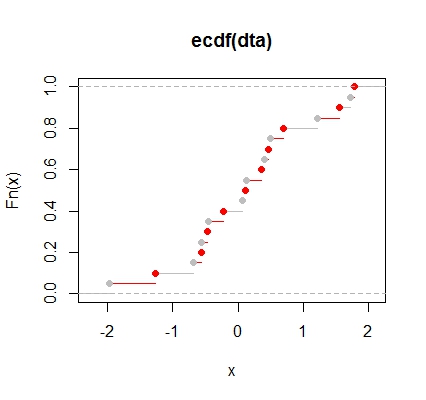
( a)使用col,这些点的左行也会被标记:
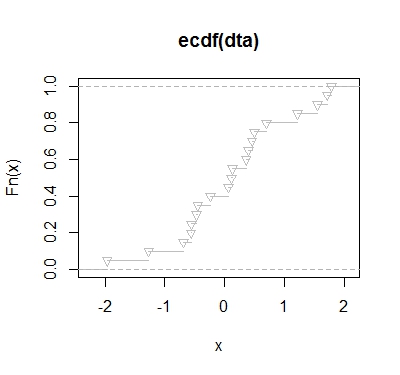
( b)即使指定一个通常使用bg的pch,使用pch也没有任何效果:
我的错误在哪里?是否有一种简单的方法(然后提取ecdf函数数据并手工创建绘图)?我更喜欢平面图,而不是画图等等。谢谢!
set.seed(seed=123)
dta=rnorm(20)
plot(1:2, pch=c(19, 25), col="blue", bg="red", cex=5, lwd=4)
# works perfectly (note: pch=19 only has col, no bg, whereas others (e.g. 25) have col (border) and bg (fill))

# a)
plot(ecdf(dta), pch=19, col=c("gray","red"))
# colored symbols AND lines, but I only want to color the symbols (see 1st figure above)

# b)
plot(ecdf(dta), pch=25, col="gray",bg="red")
# specifying bg does not work from plot.ecdf (see 2nd fig. above)回答 1
Stack Overflow用户
回答已采纳
发布于 2014-08-31 15:11:59
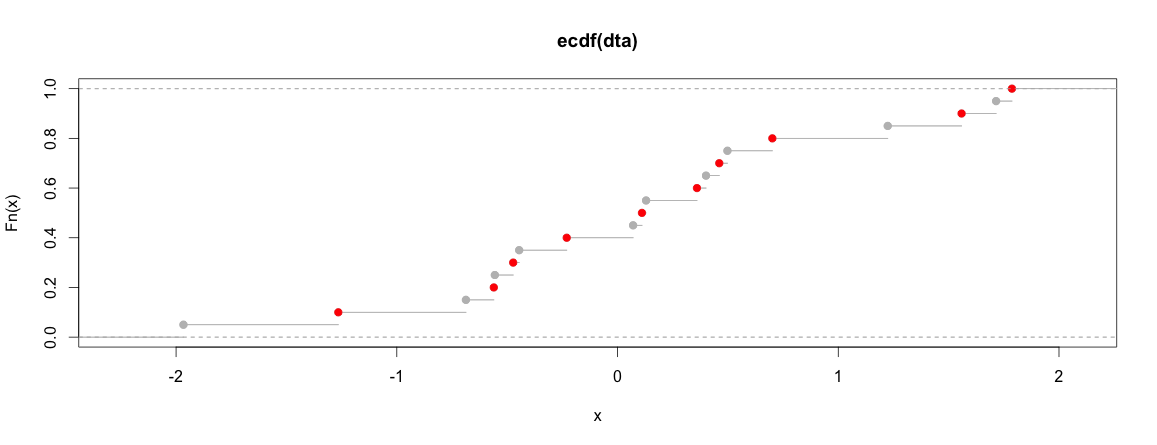
这对你有用吗?
set.seed(seed=123)
dta=rnorm(20)
##
plot(ecdf(dta), pch=19,
    col="gray",
    col.01line = "gray")
lines(ecdf(dta),col="gray",
      col.points=c(
        rep(c("gray","red"),20)))
##
编辑:甚至更容易(不需要额外的lines调用)在可以直接用于plot.stepfun的调整参数上合并:
# nonsense colors, just to illustrate the possibility to set further parameters:
? plot.stepfun # has many more parameters!!
plot(ecdf(dta), pch=19,
     col="blue",
     col.points=c(
       rep(c("gray","red"),20)),
     verticals=TRUE, col.vert="pink",
col.01line = "green")页面原文内容由Stack Overflow提供。腾讯云小微IT领域专用引擎提供翻译支持
原文链接:
https://stackoverflow.com/questions/25592410
复制相关文章
相似问题
腾讯云开发者

Copyright © 2013 - 2026 Tencent Cloud. All Rights Reserved. 腾讯云 版权所有
深圳市腾讯计算机系统有限公司 ICP备案/许可证号:粤B2-20090059 ![]() 粤公网安备44030502008569号
粤公网安备44030502008569号
腾讯云计算(北京)有限责任公司 京ICP证150476号 | 京ICP备11018762号