
ggplot2中的条带图
ggplot2中的条带图
提问于 2014-08-24 17:14:41
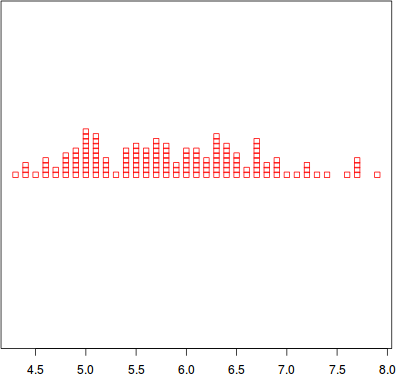
知道如何在ggplot2中绘制条纹图吗?下面是基R中的示例。
stripchart(iris$Sepal.Length, col = "red", method="stack")
回答 1
Stack Overflow用户
回答已采纳
发布于 2014-08-25 07:44:59
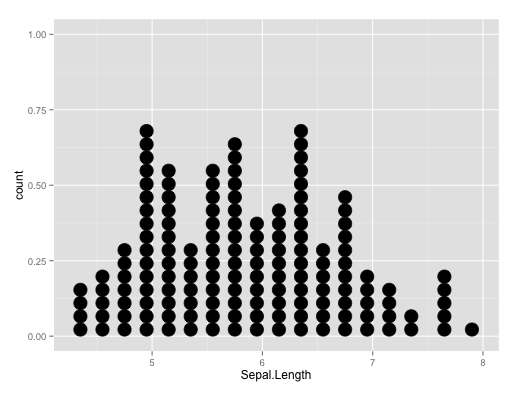
您可以使用geom_dotplot
library(ggplot2)
ggplot(iris, aes(x = Sepal.Length)) +
  geom_dotplot()
页面原文内容由Stack Overflow提供。腾讯云小微IT领域专用引擎提供翻译支持
原文链接:
https://stackoverflow.com/questions/25474242
复制相关文章
相似问题
腾讯云开发者

Copyright © 2013 - 2026 Tencent Cloud. All Rights Reserved. 腾讯云 版权所有
深圳市腾讯计算机系统有限公司 ICP备案/许可证号:粤B2-20090059 ![]() 粤公网安备44030502008569号
粤公网安备44030502008569号
腾讯云计算(北京)有限责任公司 京ICP证150476号 | 京ICP备11018762号