
rsm对象的等高线和透视图
rsm对象的等高线和透视图
提问于 2014-08-22 15:51:13
我想获得rsm对象的轮廓图和透视图,用于Block的每个级别的因素。
输出
最小工作实例
library(rsm)
CR <- coded.data (ChemReact, x1~(Time-85)/5, x2~(Temp-175)/5)
CR.rs2 <- rsm (Yield ~ Block + SO(x1,x2), data=CR)
summary(CR.rs2)
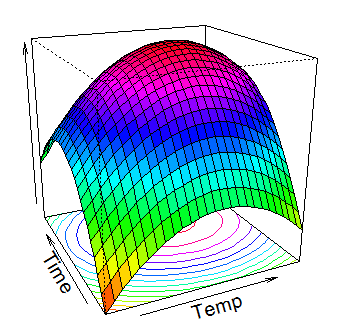
persp(
CR.rs2
, x1 ~ x2
, col = rainbow(50)
, ticktype = "simple"
, contour = ("colors")
)
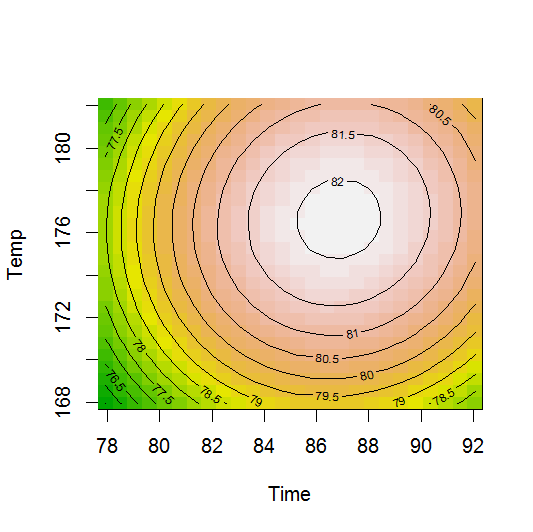
contour(CR.rs2, ~ x1 + x2, image = TRUE, at = summary(CR.rs2)$canonical$xs)编辑过的
期望输出
等高线图
- 第一座时间与温度的等高线图
- 第二座时间与温度的等高线图
透视图
- 第1块的时间和温度之间的透视图
- 第2块的时间和温度之间的透视图
回答 2
Stack Overflow用户
回答已采纳
发布于 2014-08-27 13:16:53
只需将该块包含在at参数中:
contour(CR.rs2, ~ x1 + x2, image = TRUE,
    at = c(summary(CR.rs2)$canonical$xs, Block="B1"))

contour(CR.rs2, ~ x1 + x2, image = TRUE,
at = c(summary(CR.rs2)$canonical$xs, Block="B2"))..。persp也是如此
Stack Overflow用户
发布于 2014-08-22 19:10:05
persp.lm中为persp部件设置数据的行是:
plot.data = contour.lm(x, form, at, bounds, zlim, xlabs,
    atpos = atpos, plot.it = FALSE)
查看一下plot.data在contour.lm yous ee中的构造,它是一个列表:
 plot.data[[i]] = list(x = x, y = y, z = matrix(z, nrow = length(x)),
        labs = labs)
比较contour.lm的输出和原始模型中的系数,您可以看到所绘制的图(最大值为82)是一个平均响应面(因为Intercept为84.095,块效应为-4.458 )。因此,将输出从contour.lm中提取出来,并将其用于绘制适当调整为单个效果的赋值:
> plt <- contour.lm(CR.rs2, x1 ~ x2, plot.it=FALSE)
> names(plt)
[1] "x2 ~ x1"
> str(plt)
List of 1
 $ x2 ~ x1:List of 5
  ..$ x   : num [1:26] 168 168 169 170 170 ...
  ..$ y   : num [1:26] 77.9 78.5 79.1 79.6 80.2 ...
  ..$ z   : num [1:26, 1:26] 75.5 75.8 76.1 76.4 76.7 ...
  ..$ labs: Named chr [1:5] "Temp" "Time" "x2" "x1" ...
  .. ..- attr(*, "names")= chr [1:5] "x2" "x1" "x" "y" ...
..$ zlim: num [1:2] 75.5 82.1页面原文内容由Stack Overflow提供。腾讯云小微IT领域专用引擎提供翻译支持
原文链接:
https://stackoverflow.com/questions/25450952
复制相关文章
相似问题
腾讯云开发者

Copyright © 2013 - 2026 Tencent Cloud. All Rights Reserved. 腾讯云 版权所有
深圳市腾讯计算机系统有限公司 ICP备案/许可证号:粤B2-20090059 ![]() 粤公网安备44030502008569号
粤公网安备44030502008569号
腾讯云计算(北京)有限责任公司 京ICP证150476号 | 京ICP备11018762号