
如何在autoKrige中插入x和y标签和勾标?
如何在autoKrige中插入x和y标签和勾标?
提问于 2014-08-15 10:07:00
使用了两个数据集:
- 3列空间数据(x,y,data)
- 2列(x,y)中的网格数据
automap包autoKrige可以计算克里格,并可以用no、x和y勾标和标签绘制:
plot(kriging_result)
automapPlot(kriging_result$krige_output, "var1.pred", sp.layout = list("sp.points", shimadata), main="OK without grids", xlab="x", ylab="y")
当我使用ggplot2包时,它会显示错误,但是它计算克里格:
mydata<-read.table("D:/.../mydata.txt",header=T,sep=",")
#Renaming desired columns:
x<-mydata[,1]
y<-mydata[,2]
waterelev<-mydata[,3]
library(gstat)
coordinates(mydata)=~x+y
library(ggplot2)
theme_set(theme_bw())
library(scales)
library(automap)
grids<-read.table("D:/.../grids.txt",header=T,sep=",")
gridded(grids)=~x+y
kriging_result = autoKrige(log(waterelev)~1, mydata)
#This line turns the log(data) back to the original data:
kriging_result$krige_output$var1.pred<-exp(kriging_result$krige_output$var1.pred)
library(reshape2)
ggplot_data = as.data.frame(kriging_result$krige_output)
ggplot(ggplot_data, aes(x = x, y = y, fill = var1.pred)) +
   geom_raster() + coord_fixed() +
   scale_fill_gradient(low = 'white', high = muted('blue'))
错误:
错误:美学必须是长度为1,或与数据相同的长度:x,y
回答 2
Stack Overflow用户
回答已采纳
发布于 2014-08-17 09:33:25
我使用了您提供的数据集,并将结果像图像一样发布:
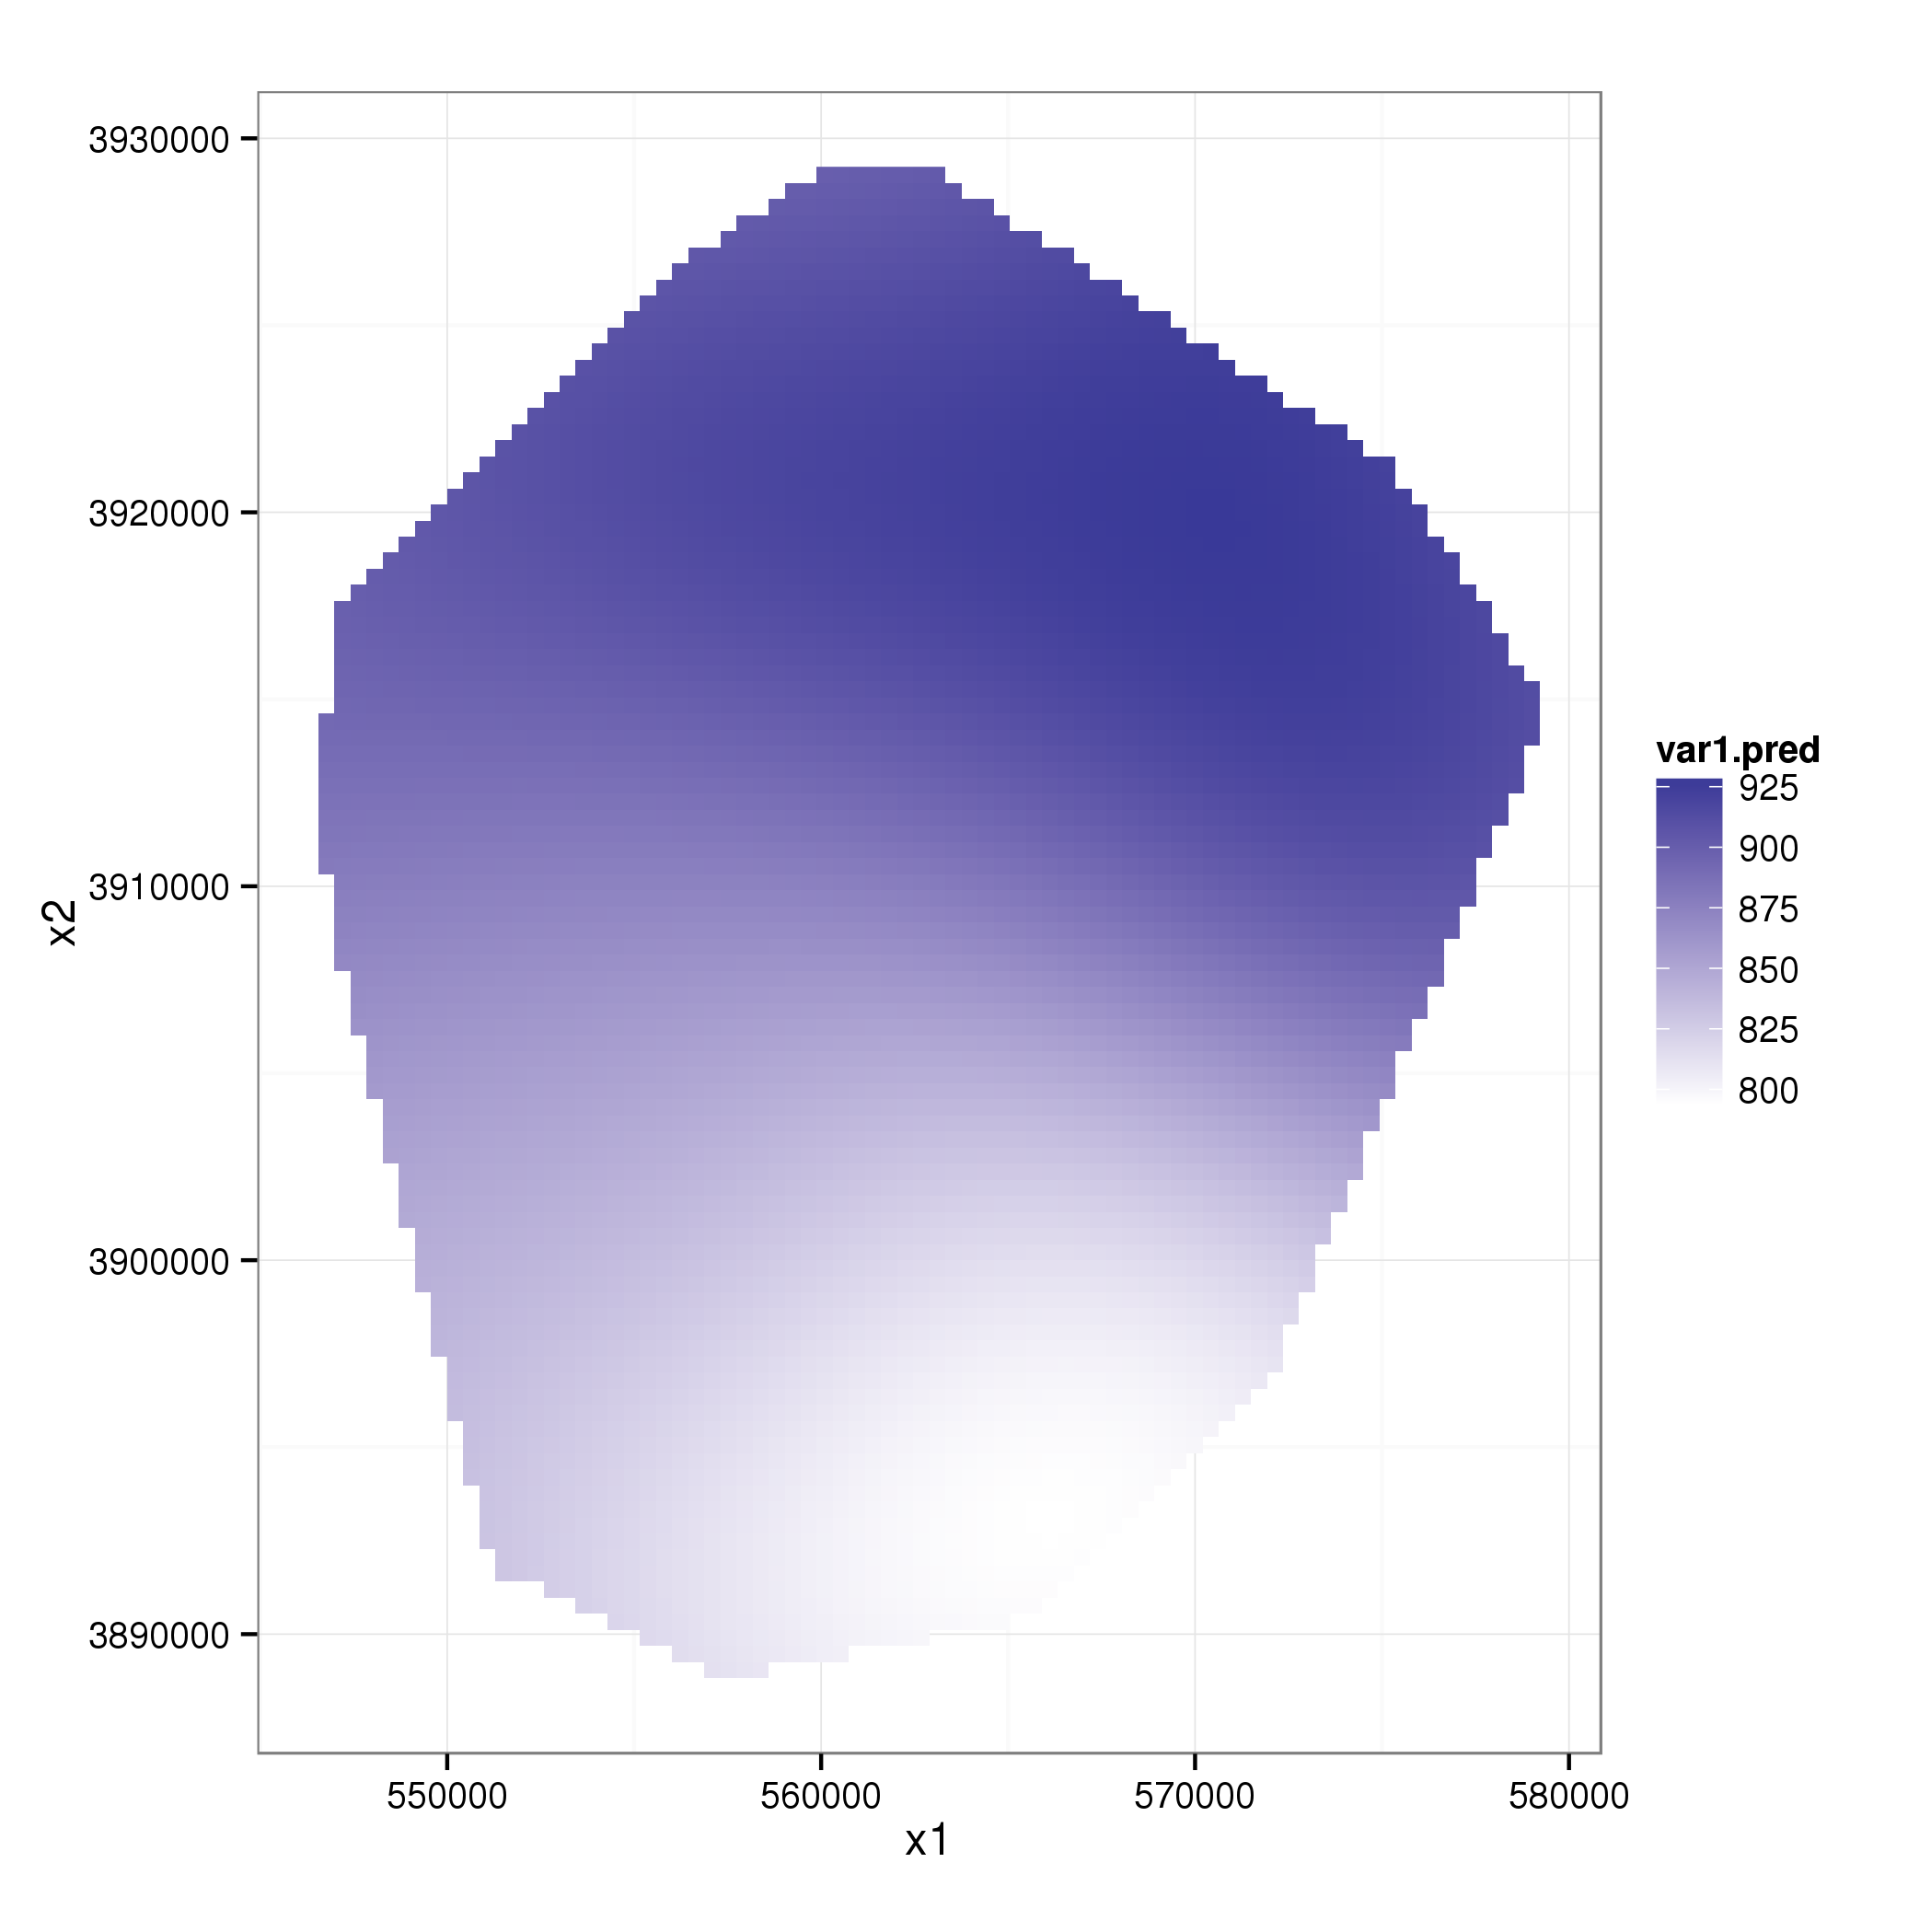
我只是运行您的代码,直到ggplot_data从一个spPointsDataFrame (网格)生成到一个data.frame (使用reshape2)。然后,我一步一步地构建了ggplot对象,但没有发现任何错误:
g=ggplot(data=ggplot_data,aes(x=x1,y=x2,fill=var1.pred))
g=g+geom_raster()
g=g+coord_fixed()
g=g+scale_fill_gradient(low = 'white', high = muted('blue'))
print(g)
这是你所期望的吗?
Stack Overflow用户
发布于 2014-08-15 14:33:56
automapPlot函数是spplot的包装器,因此任何适用于spplot的修复都适用于automapPlot。您可以从spplot文档开始,以便找到一个起点。
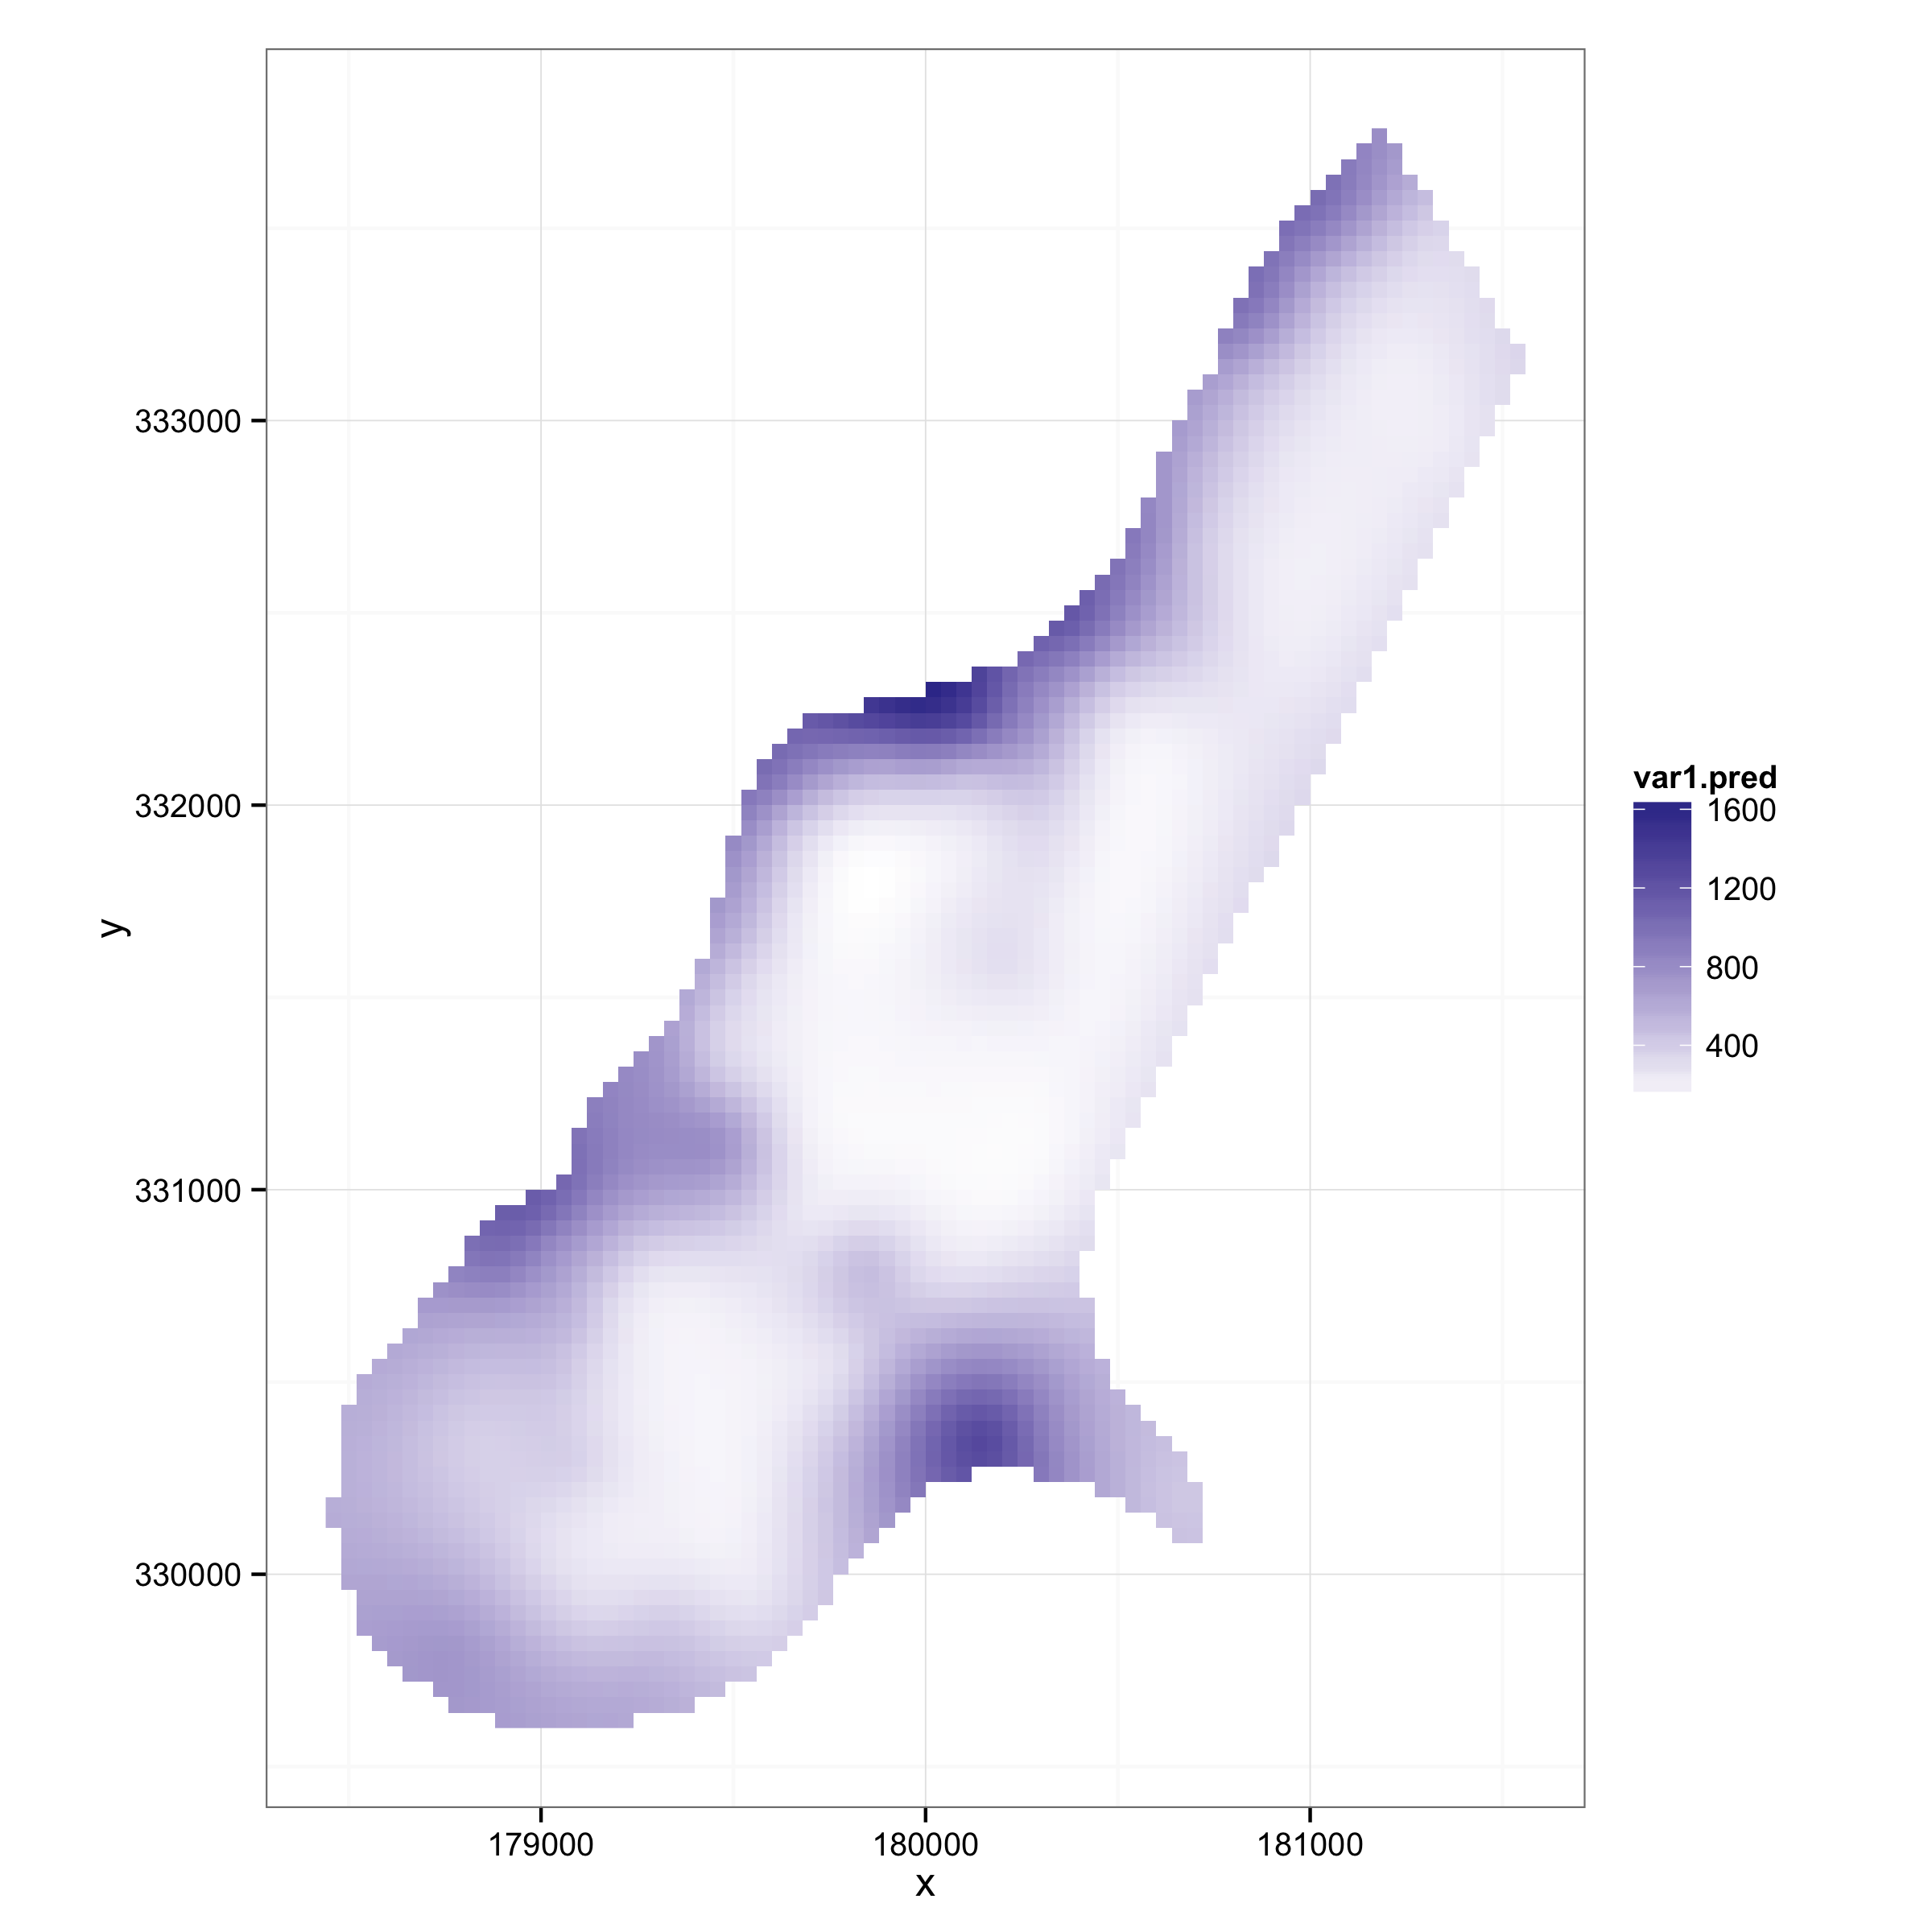
但是,我通常使用ggplot2包进行任何绘图工作,包括空间数据。下面是一个再现automapPlot结果的示例:
library(ggplot2)
theme_set(theme_bw())
library(scales)
library(automap)
data(meuse)
coordinates(meuse) =~ x+y
data(meuse.grid)
gridded(meuse.grid) =~ x+y
kriging_result = autoKrige(zinc~1, meuse, meuse.grid)

# Cast the Spatial object to a data.frame
library(reshape2)
ggplot_data = as.data.frame(kriging_result$krige_output)

ggplot(ggplot_data, aes(x = x, y = y, fill = var1.pred)) +
    geom_raster() + coord_fixed() +
    scale_fill_gradient(low = 'white', high = muted('blue'))
页面原文内容由Stack Overflow提供。腾讯云小微IT领域专用引擎提供翻译支持
原文链接:
https://stackoverflow.com/questions/25324648
复制相关文章
相似问题
腾讯云开发者

Copyright © 2013 - 2026 Tencent Cloud. All Rights Reserved. 腾讯云 版权所有
深圳市腾讯计算机系统有限公司 ICP备案/许可证号:粤B2-20090059 ![]() 粤公网安备44030502008569号
粤公网安备44030502008569号
腾讯云计算(北京)有限责任公司 京ICP证150476号 | 京ICP备11018762号