
基准线倾斜的三维多边形图
基准线倾斜的三维多边形图
提问于 2014-07-30 18:44:45
我正在尝试创建我自己版本的3D多边形图,如Matplotlib网站所示:
toolkits/mplot3d/tutorial.html#polygon-plots
我的版本在这里:
http://hastebin.com/laqekeceru.py
示例数据:
http://hastebin.com/vocagogihu.coffee
来自两个不同视图的图像输出如下:
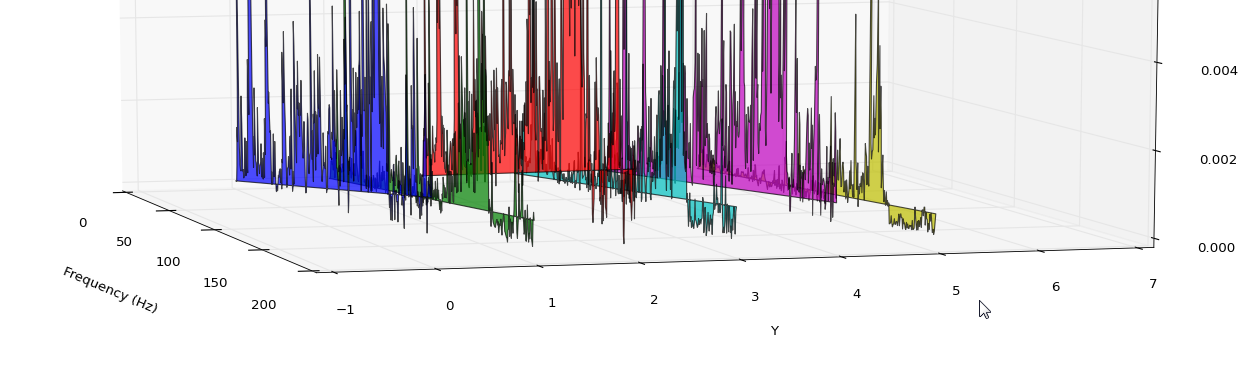
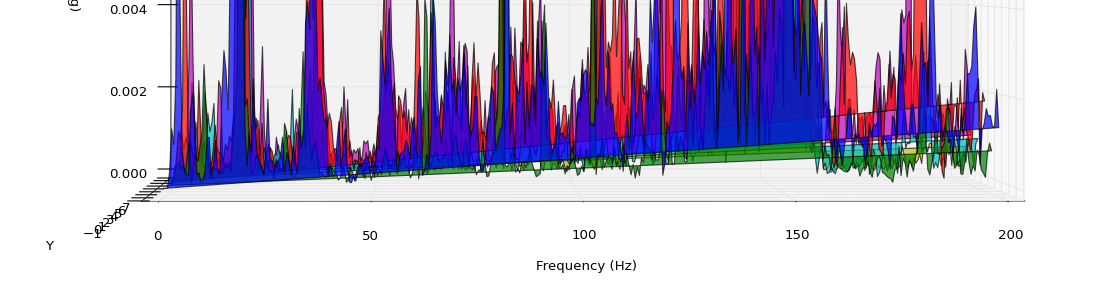
正如你在图像中所看到的,图的基线开始逐渐倾斜。
我尝试了教程版本,它运行得很好,但是它的数据要少得多。
这是matplotlib中的一个bug吗?这是我的密码吗?
我在用:
- Windows 7
- Python2.6
- numpy==1.8.0
- matplotlib==1.3.1 (最新版本)
提前谢谢。
回答 1
Stack Overflow用户
回答已采纳
发布于 2014-07-30 20:44:46
这只是与多边形有关,而不是特定于3d。
您的PolyCollection是形成闭多边形的点的集合。“爬行”基线实际上是多边形的一侧,从最后一点到每个多边形的第一点的隐式线。
为了说明这一点,请参阅:
import matplotlib.pyplot as plt
from matplotlib.collections import PolyCollection
# some sample data
data = [(0,.5), (1,.7), (2,.3), (3,.6), (4,.2)]
fig = plt.figure()
ax = fig.add_subplot(111)
# draw the polygon
p = PolyCollection([data], facecolor=(1,0,0,.5), edgecolor='none')
ax.add_collection(p)
# draw the line
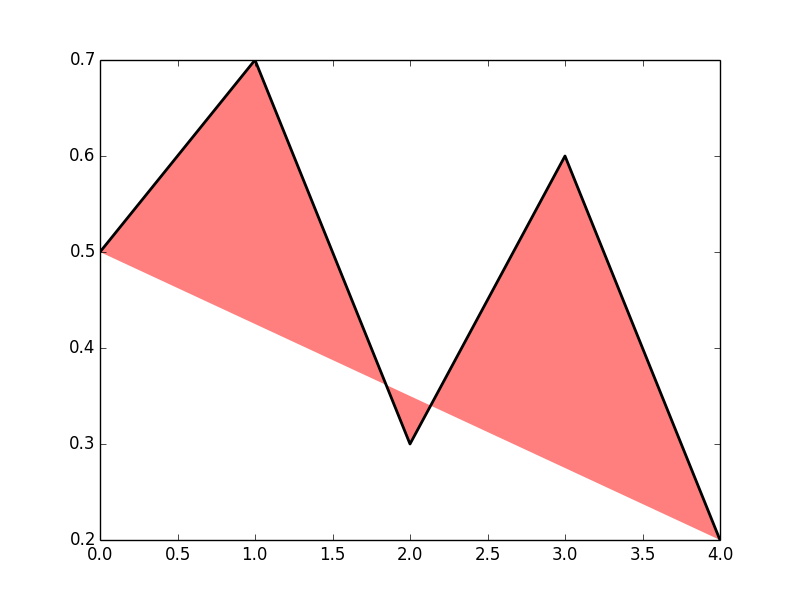
d = np.array(data)
ax.plot(*zip(*data), color='k', linewidth=2)这个简单的例子提供了:
要解决这个问题,您需要将零添加到多边形的末端:
import matplotlib.pyplot as plt
from matplotlib.collections import PolyCollection
# some sample data
data = [(0,.5), (1,.7), (2,.3), (3,.6), (4,.2)]
fig = plt.figure()
ax = fig.add_subplot(111)
# draw the polygon
# pad the data:
data.insert(0, (data[0][0],0))
data.append((data[-1][0], 0))
p = PolyCollection([data], facecolor=(1,0,0,.5), edgecolor='none')
ax.add_collection(p)
# draw the line, note that the padded points are not drawn
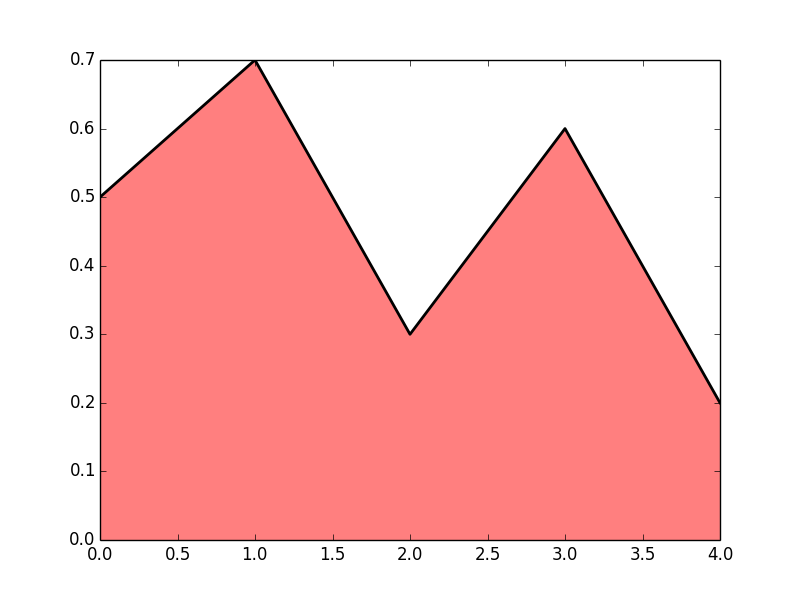
d = np.array(data)
ax.plot(*zip(*data[1:-1]), color='k', linewidth=2)现在斜线走了:
如果您需要在多边形的边缘绘制曲线,则需要分别绘制它(因为多边形的边缘是您不想显示的)。
页面原文内容由Stack Overflow提供。腾讯云小微IT领域专用引擎提供翻译支持
原文链接:
https://stackoverflow.com/questions/25044549
复制相关文章
相似问题
腾讯云开发者

Copyright © 2013 - 2026 Tencent Cloud. All Rights Reserved. 腾讯云 版权所有
深圳市腾讯计算机系统有限公司 ICP备案/许可证号:粤B2-20090059 ![]() 粤公网安备44030502008569号
粤公网安备44030502008569号
腾讯云计算(北京)有限责任公司 京ICP证150476号 | 京ICP备11018762号