
如何在直接标签“box.color”中配置draw.rects?
如何在直接标签“box.color”中配置draw.rects?
提问于 2014-07-18 00:33:45
下面是我的工作示例:
library(ggplot2)
library(directlabels)  # ver 2014.6.13 via r-forge
DF <- expand.grid(z = seq(1, 3001, by=10), k = seq(from=0.5, to=5, by=0.25))

# Defines the function value for each z-k combination
DF$dT <- with(DF, -0.07 * z * (1/2.75 - 1/k))

p <- ggplot(DF, aes(x = z, y = k, z = dT)) +  theme_bw() +
 stat_contour(aes(colour=..level..), breaks=c(seq(from=-40, to=0, by=5), c(seq(from=5, to=150, by=10))))
angled.boxes <- list("far.from.others.borders","calc.boxes","enlarge.box","draw.rects")
direct.label(p, "angled.boxes")
看起来是这样的:
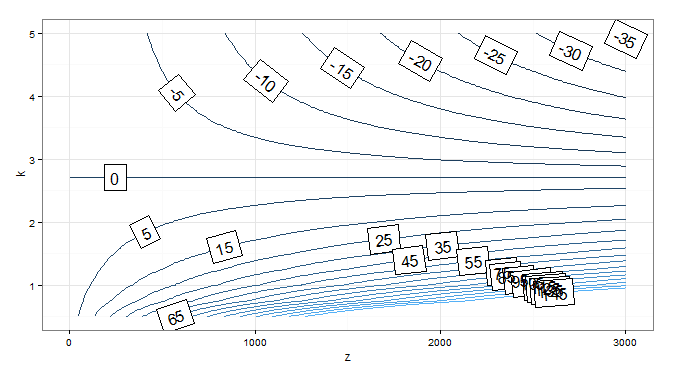
我想把标签框边框的颜色变成“白色”,但我不知道该怎么做。在这个包的新闻里,写着:
2.5 --2012年4月6日 draw.rects具有可配置的颜色,默认黑色。
被视为"angled.boxes“的清单包括:
angled.boxes <- list("far.from.others.borders","calc.boxes","enlarge.box","draw.rects")我想这是可能的,但是怎么做呢?
回答 2
Stack Overflow用户
回答已采纳
发布于 2014-07-18 04:49:22
这似乎是一次黑客攻击,但成功了。我只是重新定义了draw.rects函数,因为我看不出如何将参数传递给它,因为directlabels调用其函数的方式很笨拙。(非常喜欢。我从来没有习惯过函数是字符值):
assignInNamespace( 'draw.rects',
function (d, ...)
{
if (is.null(d$box.color))
d$box.color <- "red"
if (is.null(d$fill))
d$fill <- "white"
for (i in 1:nrow(d)) {
with(d[i, ], {
grid.rect(gp = gpar(col = box.color, fill = fill),
vp = viewport(x, y, w, h, "cm", c(hjust, vjust),
angle = rot))
})
}
d
}, ns='directlabels')
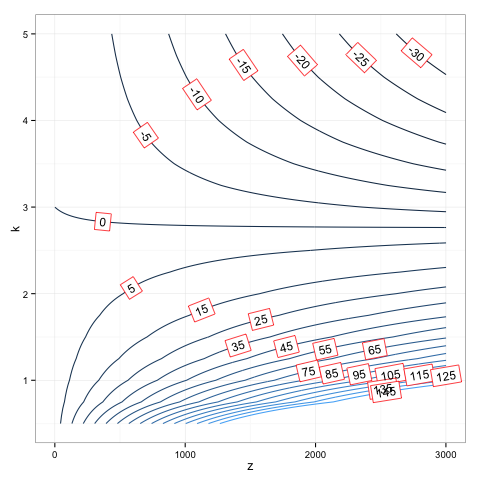
dlp <- direct.label(p, "angled.boxes")
dlp
Stack Overflow用户
发布于 2014-07-28 23:57:27
我也有一个包裹的作者,托比霍金的答复。这两种方法中的任何一种都能奏效:
my.dl <- list(dl.trans(box.color="red"),"draw.rects")
direct.label(p, list("far.from.others.borders","calc.boxes", "enlarge.box", "my.dl"))
或(捷径)
my.dl <- list(box.color="red", "draw.rects")
direct.label(p, list("far.from.others.borders","calc.boxes", "enlarge.box", "my.dl"))页面原文内容由Stack Overflow提供。腾讯云小微IT领域专用引擎提供翻译支持
原文链接:
https://stackoverflow.com/questions/24815672
复制相关文章
相似问题
腾讯云开发者

Copyright © 2013 - 2026 Tencent Cloud. All Rights Reserved. 腾讯云 版权所有
深圳市腾讯计算机系统有限公司 ICP备案/许可证号:粤B2-20090059 ![]() 粤公网安备44030502008569号
粤公网安备44030502008569号
腾讯云计算(北京)有限责任公司 京ICP证150476号 | 京ICP备11018762号