
绑定DataPoint颜色
绑定DataPoint颜色
提问于 2014-07-04 03:37:22
下面是我用于DataPointStyle of a LineSeries的样式:
<Style x:Key="LineDataPointStyle" TargetType="chrt:LineDataPoint">
    <Setter Property="Background" Value="#0077CC" />
    <Setter Property="BorderBrush" Value="White" />
    <Setter Property="BorderThickness" Value="2" />
    <Setter Property="IsTabStop" Value="False" />
    <Setter Property="Height" Value="10" />
    <Setter Property="Width" Value="10" />
    <Setter Property="Template">
        <Setter.Value>
            <ControlTemplate TargetType="chrt:LineDataPoint">
                <Grid x:Name="Root" Opacity="1">
                    <ToolTipService.ToolTip>
                        <StackPanel Margin="2,2,2,2">
                            <ContentControl Content="{TemplateBinding IndependentValue}" ContentStringFormat="X-Value: {0:HH:mm:ss}"/>
                            <ContentControl Content="{TemplateBinding DependentValue}" ContentStringFormat="Y-Value: {0:###.###}"/>
                        </StackPanel>
                    </ToolTipService.ToolTip>
                    <Ellipse StrokeThickness="{TemplateBinding BorderThickness}" Stroke="{TemplateBinding BorderBrush}" Fill="{TemplateBinding Background}"/>
                </Grid>
            </ControlTemplate>
        </Setter.Value>
    </Setter>
</Style>
我希望在运行时设置它,而不是硬编码背景属性。如何将背景绑定到LineSeries的背景中?
回答 1
Stack Overflow用户
发布于 2014-07-04 12:40:13
试试下面的解决办法。
资源
 <Window.Resources>
    <Style x:Key="DataPointStyle" TargetType="chartingToolkit:DataPoint">
        <Setter Property="Background" Value="{DynamicResource ChartLineColor}"/>
        <Setter Property="BorderThickness" Value="2"/>
        <Setter Property="BorderBrush" Value="White"/>
        <Setter Property="IsTabStop" Value="False"/>
        <Setter Property="Height" Value="10" />
        <Setter Property="Width" Value="10" />
        <Setter Property="Template">
            <Setter.Value>
                <ControlTemplate TargetType="chartingToolkit:LineDataPoint">
                    <Grid x:Name="Root" Opacity="1">
                        <ToolTipService.ToolTip>
                            <StackPanel Margin="2,2,2,2">
                                <ContentControl Content="{TemplateBinding IndependentValue}" ContentStringFormat="Date : {0}"/>
                                <ContentControl Content="{TemplateBinding DependentValue}" ContentStringFormat="Count : {0:###,###,###}"/>
                            </StackPanel>
                        </ToolTipService.ToolTip>
                        <Ellipse StrokeThickness="{TemplateBinding BorderThickness}" Stroke="{TemplateBinding BorderBrush}" Fill="{TemplateBinding Background}"/>
                    </Grid>
                </ControlTemplate>
            </Setter.Value>
        </Setter>
    </Style>
</Window.Resources>
xaml
<Grid>
<Grid.ColumnDefinitions>
<ColumnDefinition/>
<ColumnDefinition/>
</Grid.ColumnDefinitions>
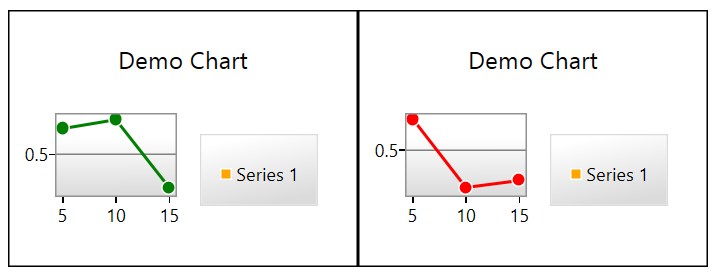
<chartingToolkit:Chart x:Name="LineChart" Title="Demo Chart">
<chartingToolkit:LineSeries DependentValuePath="Value" DataPointStyle="{StaticResource DataPointStyle}" IndependentValuePath="Key" ItemsSource="{Binding}" IsSelectionEnabled="True">
<chartingToolkit:LineSeries.Resources>
<SolidColorBrush x:Key="ChartLineColor" Color="Green"/>
</chartingToolkit:LineSeries.Resources>
</chartingToolkit:LineSeries>
</chartingToolkit:Chart>
<chartingToolkit:Chart x:Name="LineChart1" Grid.Column="1" Title="Demo Chart">
<chartingToolkit:LineSeries DependentValuePath="Value" DataPointStyle="{StaticResource DataPointStyle}" IndependentValuePath="Key" ItemsSource="{Binding}" IsSelectionEnabled="True">
<chartingToolkit:LineSeries.Resources>
<SolidColorBrush x:Key="ChartLineColor" Color="Red"/>
</chartingToolkit:LineSeries.Resources>
</chartingToolkit:LineSeries>
</chartingToolkit:Chart>
</Grid>结果
页面原文内容由Stack Overflow提供。腾讯云小微IT领域专用引擎提供翻译支持
原文链接:
https://stackoverflow.com/questions/24566341
复制相关文章
相似问题
腾讯云开发者

Copyright © 2013 - 2026 Tencent Cloud. All Rights Reserved. 腾讯云 版权所有
深圳市腾讯计算机系统有限公司 ICP备案/许可证号:粤B2-20090059 ![]() 粤公网安备44030502008569号
粤公网安备44030502008569号
腾讯云计算(北京)有限责任公司 京ICP证150476号 | 京ICP备11018762号