
将x轴标签放到表格的第一个颜色中-高图表
将x轴标签放到表格的第一个颜色中-高图表
提问于 2014-06-24 09:26:00
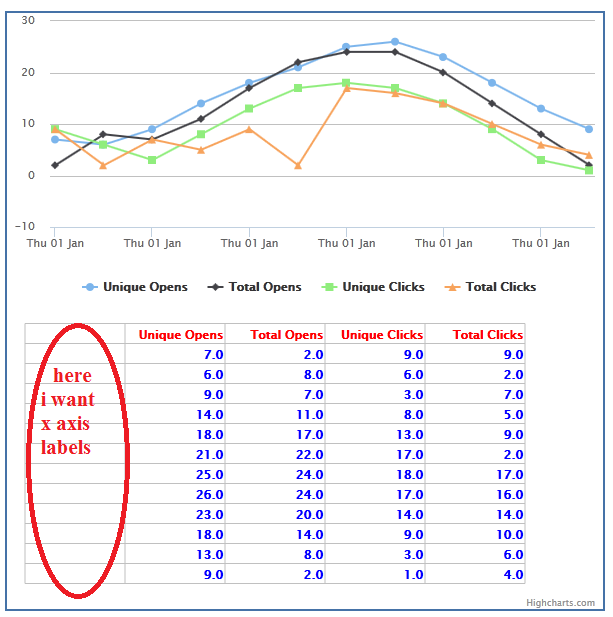
我正在尝试从highcharts创建一个表。
我把所有的数据正确地作为第一列的table.but,我需要x轴标签。如何得到它。作为列头,我需要date,作为列值,我需要日期值。
见jsfiidle演示。
截图:
我使用以下代码:
Highcharts.drawTable = function() {

// user options
var tableTop = 310,
    colWidth = 100,
    tableLeft = 20,
    rowHeight = 20,
    cellPadding = 2.5,
    valueDecimals = 1,
    valueSuffix = '';

// internal variables
var chart = this,
    series = chart.series,
    renderer = chart.renderer,
    cellLeft = tableLeft;

// draw category labels
$.each(chart.xAxis[0].categories, function(i, name) {

    renderer.text(
        name,
        cellLeft + cellPadding,
        tableTop + (i + 2) * rowHeight - cellPadding
    )
    .css({
        fontWeight: 'bold',


    })
    .add();
});


$.each(series, function(i, serie) {
    cellLeft += colWidth;

    // Apply the cell text
    renderer.text(
            serie.name,
            cellLeft - cellPadding + colWidth,
            tableTop + rowHeight - cellPadding
        )
        .attr({
            align: 'right'
        })
        .css({
            fontWeight: 'bold',
            color:'red'
        })
        .add();

    $.each(serie.data, function(row, point) {

        // Apply the cell text
        renderer.text(
                Highcharts.numberFormat(point.y, valueDecimals) + valueSuffix,
                cellLeft + colWidth - cellPadding,
                tableTop + (row + 2) * rowHeight - cellPadding
            )
            .attr({
                align: 'right'
            })
            .css({
            fontWeight: 'bold',
            color:'blue'
        })
            .add();

        // horizontal lines
        if (row == 0) {
            Highcharts.tableLine( // top
                renderer,
                tableLeft,
                tableTop + cellPadding,
                cellLeft + colWidth,
                tableTop + cellPadding
            );
            Highcharts.tableLine( // bottom
                renderer,
                tableLeft,
                tableTop + (serie.data.length + 1) * rowHeight + cellPadding,
                cellLeft + colWidth,
                tableTop + (serie.data.length + 1) * rowHeight + cellPadding
            );
        }
        // horizontal line
        Highcharts.tableLine(
            renderer,
            tableLeft,
            tableTop + row * rowHeight + rowHeight + cellPadding,
            cellLeft + colWidth,
            tableTop + row * rowHeight + rowHeight + cellPadding
        );

    });

    // vertical lines
    if (i == 0) { // left table border
        Highcharts.tableLine(
            renderer,
            tableLeft,
            tableTop + cellPadding,
            tableLeft,
            tableTop + (serie.data.length + 1) * rowHeight + cellPadding
        );
    }

    Highcharts.tableLine(
        renderer,
        cellLeft,
        tableTop + cellPadding,
        cellLeft,
        tableTop + (serie.data.length + 1) * rowHeight + cellPadding
    );

    if (i == series.length - 1) { // right table border

        Highcharts.tableLine(
            renderer,
            cellLeft + colWidth,
            tableTop + cellPadding,
            cellLeft + colWidth,
            tableTop + (serie.data.length + 1) * rowHeight + cellPadding
        );
    }

});回答 2
Stack Overflow用户
回答已采纳
发布于 2014-06-24 10:40:28
您可以使用以下方法获取x轴标签:
Highcharts.dateFormat('%a %d %b',point.x)就像这样的http://jsfiddle.net/jxSgM/。
Stack Overflow用户
发布于 2014-06-24 10:39:18
您正在使用datetime xAxis,因此不能在drawTable代码中使用类别。相反,请使用series[0].xData,它包含来自点的所有时间戳。见演示。
更改部分:
// draw category labels
$.each(chart.series[0].xData, function(i, name) {

    renderer.text(
        Highcharts.dateFormat('%a %d %b', name),
        cellLeft + cellPadding,
        tableTop + (i + 2) * rowHeight - cellPadding
    )
    .css({
        fontWeight: 'bold',


    })
    .add();
});页面原文内容由Stack Overflow提供。腾讯云小微IT领域专用引擎提供翻译支持
原文链接:
https://stackoverflow.com/questions/24382977
复制相关文章
相似问题
腾讯云开发者

Copyright © 2013 - 2026 Tencent Cloud. All Rights Reserved. 腾讯云 版权所有
深圳市腾讯计算机系统有限公司 ICP备案/许可证号:粤B2-20090059 ![]() 粤公网安备44030502008569号
粤公网安备44030502008569号
腾讯云计算(北京)有限责任公司 京ICP证150476号 | 京ICP备11018762号