
如何绘制Voronoi Tesselation的多边形而不是分段?
如何绘制Voronoi Tesselation的多边形而不是分段?
提问于 2014-06-19 16:09:27
我找到了一种使用ggplot2绘制Voronoi图解段的方法:
library(deldir)
library(ggplot2)
library(ggthemes)
set.seed(123)
df <- data.frame(lat = rnorm(20,39,10),long = rnorm(20,-98,15))
voronoi <- deldir(df$long, df$lat)

ggplot(data=df, aes(x=long,y=lat)) +
  geom_segment(aes(x = x1, y = y1, xend = x2, yend = y2),size = 2,data = voronoi$dirsgs,linetype = 1,color= "#419AB0") +
  geom_point(fill="#EACA3E",pch=21,size = 4,color="white")
我想知道是否可以绘制多边形整数段,但我不知道如何创建一个数据集与每个多边形的轮廓。
回答 1
Stack Overflow用户
回答已采纳
发布于 2014-06-19 16:51:39
下面是将线段转换为SpatialPolygons对象的简单方法。
library(rgeos)
## Convert data.frame of segment coordinates to a list of SpatialLines objects
ll <- apply(voronoi$dirsgs, 1, FUN=function(X) {
readWKT(sprintf("LINESTRING(%s %s, %s %s)", X[1], X[2], X[3], X[4]))
})
## Convert SpatialLines list to SpatialPolygons object
pp <- gPolygonize(ll)
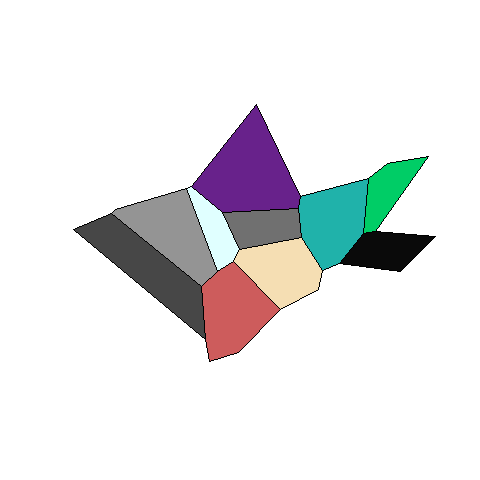
## Plot to check that it works
set.seed=11
plot(pp, col=sample(colors(), length(pp)))
页面原文内容由Stack Overflow提供。腾讯云小微IT领域专用引擎提供翻译支持
原文链接:
https://stackoverflow.com/questions/24311304
复制相关文章
相似问题
腾讯云开发者

Copyright © 2013 - 2026 Tencent Cloud. All Rights Reserved. 腾讯云 版权所有
深圳市腾讯计算机系统有限公司 ICP备案/许可证号:粤B2-20090059 ![]() 粤公网安备44030502008569号
粤公网安备44030502008569号
腾讯云计算(北京)有限责任公司 京ICP证150476号 | 京ICP备11018762号