
为什么JProfiler不在maven测试分析中显示我的类/方法?
我的maven构建中有非常长的运行测试。这些测试是与故障安全插件 (mvn verify)一起运行的集成测试。
我试图使用JProfiler对这些测试进行分析。
测试运行正常,但是,我认为在JProfiler中没有任何有用的东西,就好像JProfiler在过滤它们一样。
我在openSUSE 13.1 x64上,Maven 3.2.1和JProfiler 8.0.5
JProfiler会话设置是默认设置,但有两个修改:
- 启动时自动启动CPU分析
- 在执行完成后保持VM处于活动状态(以启用回溯信息)
我使用以下命令启动配置型构建:
MAVEN_OPTS="-agentpath:/opt/jprofiler8/bin/linux-x64/libjprofilerti.so=port=8849" mvn verifyMaven和JProfiler在同一台计算机上运行(本地分析)。
构建正常启动:
$ MAVEN_OPTS="-agentpath:/opt/jprofiler8/bin/linux-x64/libjprofilerti.so=port=8849" mvn verify
JProfiler> Protocol version 39
JProfiler> Using JVMTI
JProfiler> JVMTI version 1.1 detected.
JProfiler> 64-bit library
JProfiler> Listening on port: 8849.
JProfiler> Instrumenting native methods.
JProfiler> Can retransform classes.
JProfiler> Can retransform any class.
JProfiler> Native library initialized
JProfiler> VM initialized
JProfiler> Waiting for a connection from the JProfiler GUI ...
JProfiler> Using dynamic instrumentation
JProfiler> Time measurement: elapsed time
JProfiler> CPU profiling enabled
[INFO] Scanning for projects...
[INFO]
[INFO] Using the builder org.apache.maven.lifecycle.internal.builder.singlethreaded.SingleThreadedBuilder with a thread count of 1
[INFO]
[INFO] ------------------------------------------------------------------------
[INFO] Building...
[...]
也正常结束:
[...]
Results :

Tests run: 2766, Failures: 0, Errors: 0, Skipped: 0

[WARNING] File encoding has not been set, using platform encoding UTF-8, i.e. build is platform dependent!
[INFO] ------------------------------------------------------------------------
[INFO] BUILD SUCCESS
[INFO] ------------------------------------------------------------------------
[INFO] Total time: 19:31 min
[INFO] Finished at: 2014-06-18T11:38:49+01:00
[INFO] Final Memory: 21M/107M
[INFO] ------------------------------------------------------------------------
JProfiler> Keeping VM alive until frontend disconnects.
JProfiler热点CPU视图显示如下:
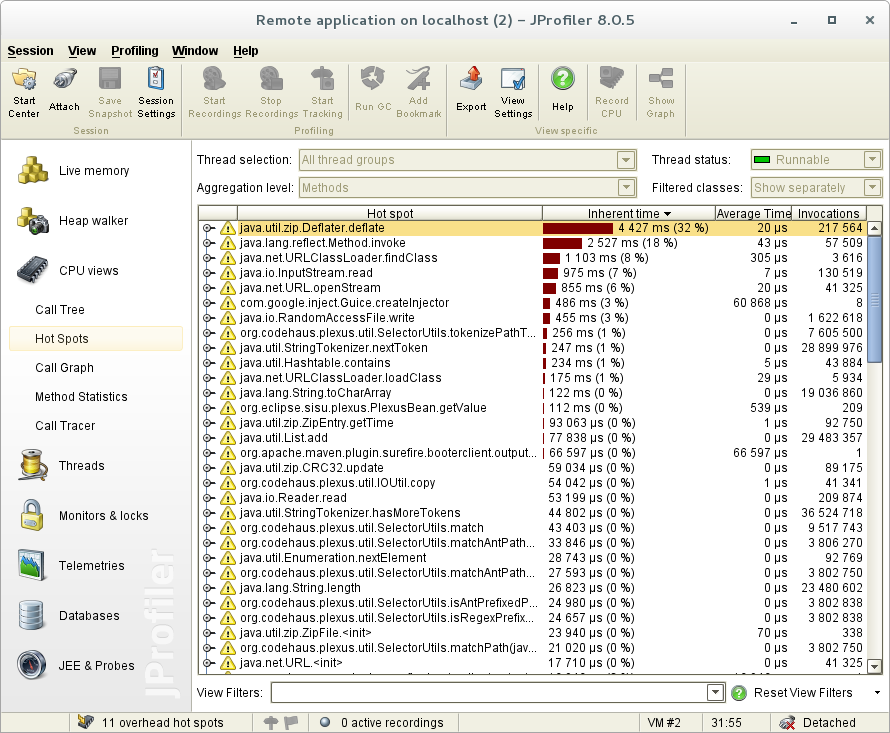
对我来说,这是无用的东西,只有maven相关的方法(拉链,类加载)。
当我尝试通过(打开热点回溯)时,我没有发现任何与我运行的测试相关的东西。
此外,与实际的总时间(~10s)相比,经过的时间(如果加上前10个热点的固有时间)很小(~19 mins 30s)。
编辑:
起初,我使用我的IDE (IntelliJ IDEA)和JProfiler插件运行测试分析,但由于一种奇怪的行为,我停止了测试。测试似乎永远都在运行,什么也不做。我认为这是来自IDE (或者插件),因为测试在maven中运行得很好。
编辑2:
感谢@IngoKegel建议,如果我选择“所有州”,我将获得更多信息:
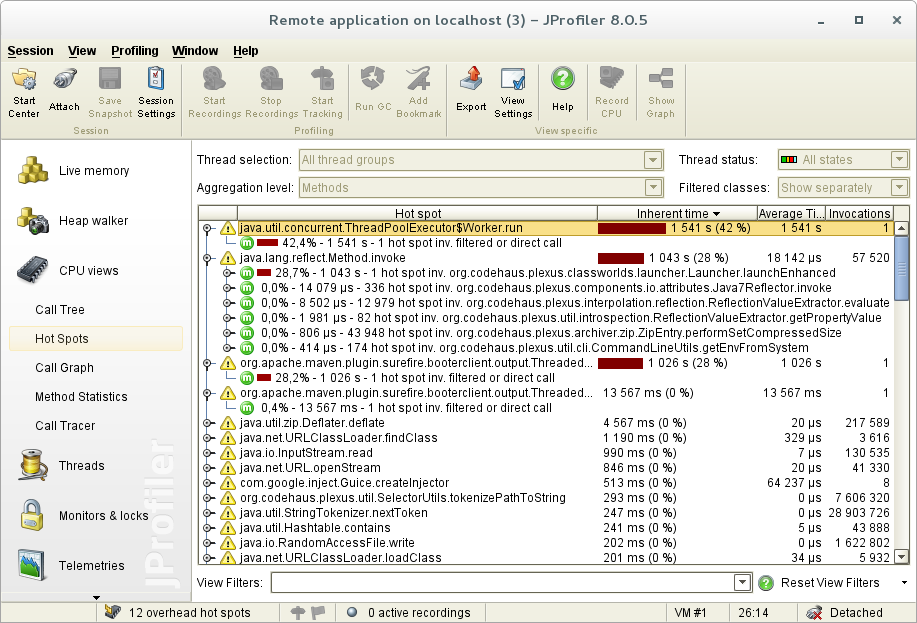
我又看到了四个热点。但是,它们仍然不能给我可用的信息:
- 是对j.u.c.ThreadPoolExecutor$Worker.run的“筛选/直接调用”。
- 是从Maven (丛)到j.l.r.Method.invoke的单个调用(+不重要的调用)
- 和4.对o.a.maven.p.surefire.booterclient.o.ThreadStreamConsumer$Pumper.run的“过滤/直接调用”
经过的时间要好得多,但我仍然没有看到来自“我的”类的任何东西。
为什么我的类仍然被过滤?有办法看到他们吗?
另外,我不完全理解为什么这些热点在选择"Runnable“状态时不显示。而且这是默认选项..。
令人惊讶的是,如果我将这些前4段时间相加,它会给我~1h,但是执行是~19min 20s,就好像有些热点是重叠的。我认为这是“所有州”选项的副作用。
回答 1
Stack Overflow用户
发布于 2014-06-23 13:40:58
诀窍是Maven 故障安全插件在单独的中运行集成测试:
具有单元测试和集成测试的典型Maven构建可以轻松地使用3种不同的JVM:
- Maven主JVM (编译,包),由
mvn命令启动- 由Maven主JVM启动的尽职尽责JVM (单元测试)
- 故障安全JVM (集成测试),由Maven主JVM启动
分析Maven主JVM将永远不会显示有关在故障安全JVM中完成的工作的信息。此外,MAVEN_OPTS中指定的选项仅传递给Maven主JVM。
要分析其他JVM之一,您必须使用pom.xml文件中的插件配置分别配置它。
要回答这个问题,它需要以下插件配置:
<plugins>
    [...]
    <plugin>
        <artifactId>maven-failsafe-plugin</artifactId>
        <version>2.17</version>
        <executions>
            <execution>
                <goals>
                    <goal>integration-test</goal>
                    <goal>verify</goal>
                    <!-- to exclude IT from main build, comment the 'verify' goal -->
                </goals>
            </execution>
        </executions>
        <configuration>
            <argLine>${failsafeArgLine}</argLine>
        </configuration>
    </plugin>
    [...]
</plugin>这里的重要部分是<argLine>${failsafeArgLine}</argLine>
然后,可以通过JProfiler参数指定failsafeArgLine代理选项:
mvn verify -DfailsafeArgLine="-agentpath:/opt/jprofiler8/bin/linux-x64/libjprofilerti.so=port=8849"运行此命令将正常启动Maven构建(不进行分析),然后当集成测试阶段开始时,它将请求一个JProfiler连接:
[...]
[INFO]
[INFO] --- maven-failsafe-plugin:2.17:integration-test (default) @ project ---
[INFO] Failsafe report directory: /home/user/Repositories/project/target/failsafe-reports

-------------------------------------------------------
 T E S T S
-------------------------------------------------------
JProfiler> Protocol version 39
JProfiler> Using JVMTI
JProfiler> JVMTI version 1.1 detected.
JProfiler> 64-bit library
JProfiler> Listening on port: 8849.
JProfiler> Instrumenting native methods.
JProfiler> Can retransform classes.
JProfiler> Can retransform any class.
JProfiler> Native library initialized
JProfiler> VM initialized
JProfiler> Waiting for a connection from the JProfiler GUI ...
JProfiler> Using dynamic instrumentation
JProfiler> Time measurement: elapsed time
JProfiler> CPU profiling enabled
[...]还可以在pom.xml文件中直接指定故障安全VM参数(而不是使用failsafeArgLine属性),但我更喜欢这样使用它。
https://stackoverflow.com/questions/24283034
复制相似问题
腾讯云开发者

Copyright © 2013 - 2026 Tencent Cloud. All Rights Reserved. 腾讯云 版权所有
深圳市腾讯计算机系统有限公司 ICP备案/许可证号:粤B2-20090059 ![]() 粤公网安备44030502008569号
粤公网安备44030502008569号
腾讯云计算(北京)有限责任公司 京ICP证150476号 | 京ICP备11018762号