
格努图直方图x对数标度
格努图直方图x对数标度
提问于 2014-06-13 14:34:44
我在bash脚本中使用gnuplot绘制了几个东西。对于这个特殊的图形,我需要打印矩阵的数量(y轴)与矩阵的大小作为x轴。由于分布可以非常稀疏,所以我想对x和y使用一个日志标度。它对y很好,但是gnuplot告诉我,当我使用直方图样式时,我不能为x轴设置一个日志标度。
有什么办法来调试这个吗?或者如何用类似的方式呈现结果?
set style data histogram
set style histogram cluster gap 1
set style fill solid border -1
set logscale xy
plot '$res/histo-$ld-$lr-$e-$r' using 2:xtic(1) title 'Run'
错误是:
line 0: Log scale on X is incompatible with histogram plots提前谢谢。
编辑:顺便说一下,我使用的是gnuket4.4修补程序4,刚刚更新到最新版本(即4.6修补程序5)。
回答 1
Stack Overflow用户
回答已采纳
发布于 2014-06-16 08:56:30
Gnuplot直方图的工作方式与您可能的想法略有不同。X轴不是数字。在您的例子中,第一行、第二列中的值放在x值为0,y-值从第二列取出来,手动标签从第一列第一行取来。第二行的值放置在x=1等处。
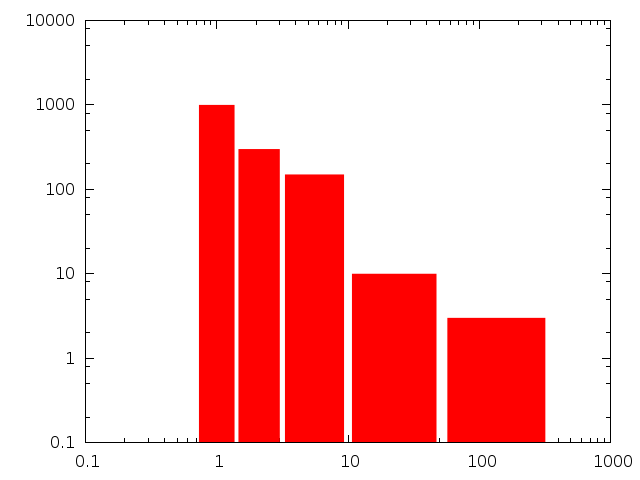
您可以尝试使用方框绘图样式,该样式与“常规”x轴一起使用,并支持x中的日志刻度:
set logscale xy
set offset 0,0,1,1
set boxwidth 0.9 relative
set style fill solid noborder
plot 'data.dat' with boxes使用数据文件data.dat
1 1000
2 300
5 150
20 10
135 3
这给出了结果( 4.6.5):
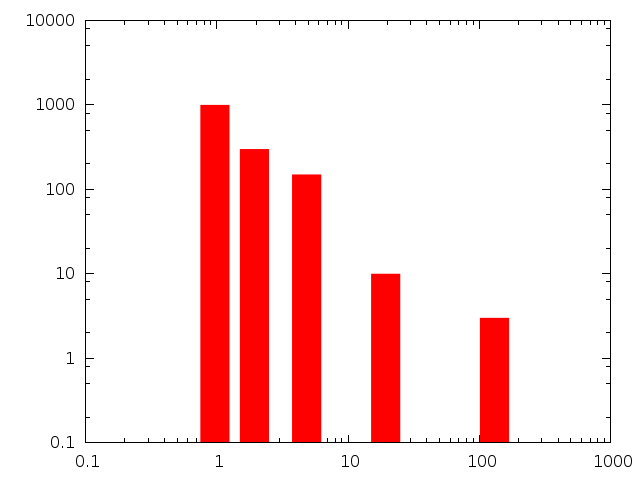
为了具有固定的盒宽和可变的盒距,可以使用第三列将框宽指定为x值的百分比:
set logscale xy
set offset 0,0,1,1
set style fill solid noborder
plot 'data.dat' using 1:2:($1*0.5) with boxes
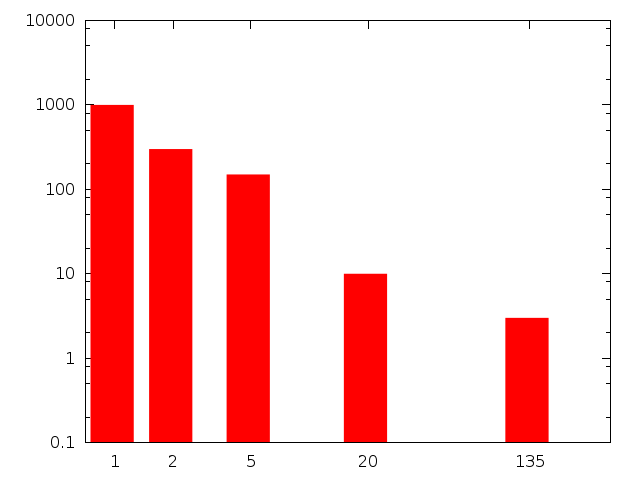
将实际值放在x轴上的工作如下:
set logscale xy
set offset 0,0,1,1
set style fill solid noborder
plot 'data.dat' using 1:2:($1*0.5):xtic(1) with boxes
页面原文内容由Stack Overflow提供。腾讯云小微IT领域专用引擎提供翻译支持
原文链接:
https://stackoverflow.com/questions/24207850
复制相关文章
相似问题
腾讯云开发者

Copyright © 2013 - 2026 Tencent Cloud. All Rights Reserved. 腾讯云 版权所有
深圳市腾讯计算机系统有限公司 ICP备案/许可证号:粤B2-20090059 ![]() 粤公网安备44030502008569号
粤公网安备44030502008569号
腾讯云计算(北京)有限责任公司 京ICP证150476号 | 京ICP备11018762号