
期望概率分布
期望概率分布
提问于 2014-06-13 13:59:28
我有一个数据"zcosmo",它遵循特定的发行版。它有许多波动(即在某个点略有增加,然后变平等),但总体上它从0增加到0.5)。因此,我使用一个函数来拟合数据,该函数跟踪数据的分布。
This function is the probability distribution lets say of the data。在这张图片中,给出了蓝线,我想用它作为概率分布函数.
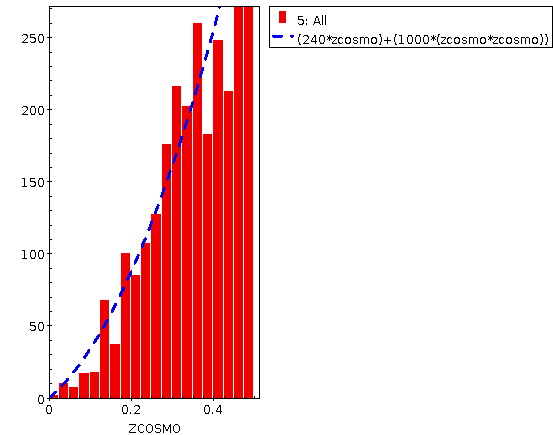
def fit(x,p1,p2):
    return (p1*x)+(p2*(x**2))
现在理论上我知道如何创建这个函数之后的数据!
- 1)计算簇红移分布(拟合函数)的红移选择函数,并将其归一化为单位,使其具有概率分布,如p(y)。
- 2)计算概率分布F( y) =和(从0到y) p(y)dy的不定积分。
- 3)随机数在0到1之间均匀偏离x。
- 4)计算y= F-1(x)
"y"将得到期望的概率分布p(y)
I am struggling to find a way to do it in Python. Is there a package that does the above??
回答 1
Stack Overflow用户
发布于 2014-06-13 14:15:52
您应该看看SciPy堆栈。它包含了用于概率与统计、数值积分和标绘的优秀库。
页面原文内容由Stack Overflow提供。腾讯云小微IT领域专用引擎提供翻译支持
原文链接:
https://stackoverflow.com/questions/24207150
复制相关文章
相似问题
腾讯云开发者

Copyright © 2013 - 2026 Tencent Cloud. All Rights Reserved. 腾讯云 版权所有
深圳市腾讯计算机系统有限公司 ICP备案/许可证号:粤B2-20090059 ![]() 粤公网安备44030502008569号
粤公网安备44030502008569号
腾讯云计算(北京)有限责任公司 京ICP证150476号 | 京ICP备11018762号