
Monetdb听诊器的度量c,m,r,w和b是什么意思?
Monetdb听诊器的度量c,m,r,w和b是什么意思?
提问于 2014-06-06 08:31:52
Monetdb的听诊器是一种分析工具,有一个跟踪选项列表。在下面的测量结果中,我被一些度量标准弄糊涂了。
时间、时间、时间和时间究竟是什么?它们似乎是用户和内核空间中的CPU时间,但是为什么MAL指令的'start‘状态有这样的utime,而'end’状态却没有?那么,它的单位是什么?
rss的单位是什么?
blk.reads blk.writes应该是I/O在块方面的速度。为什么有些指令有非零的blk.reads或blk.writes,但是它们的字节(读取的字节)和w字节(写入的字节)是零?
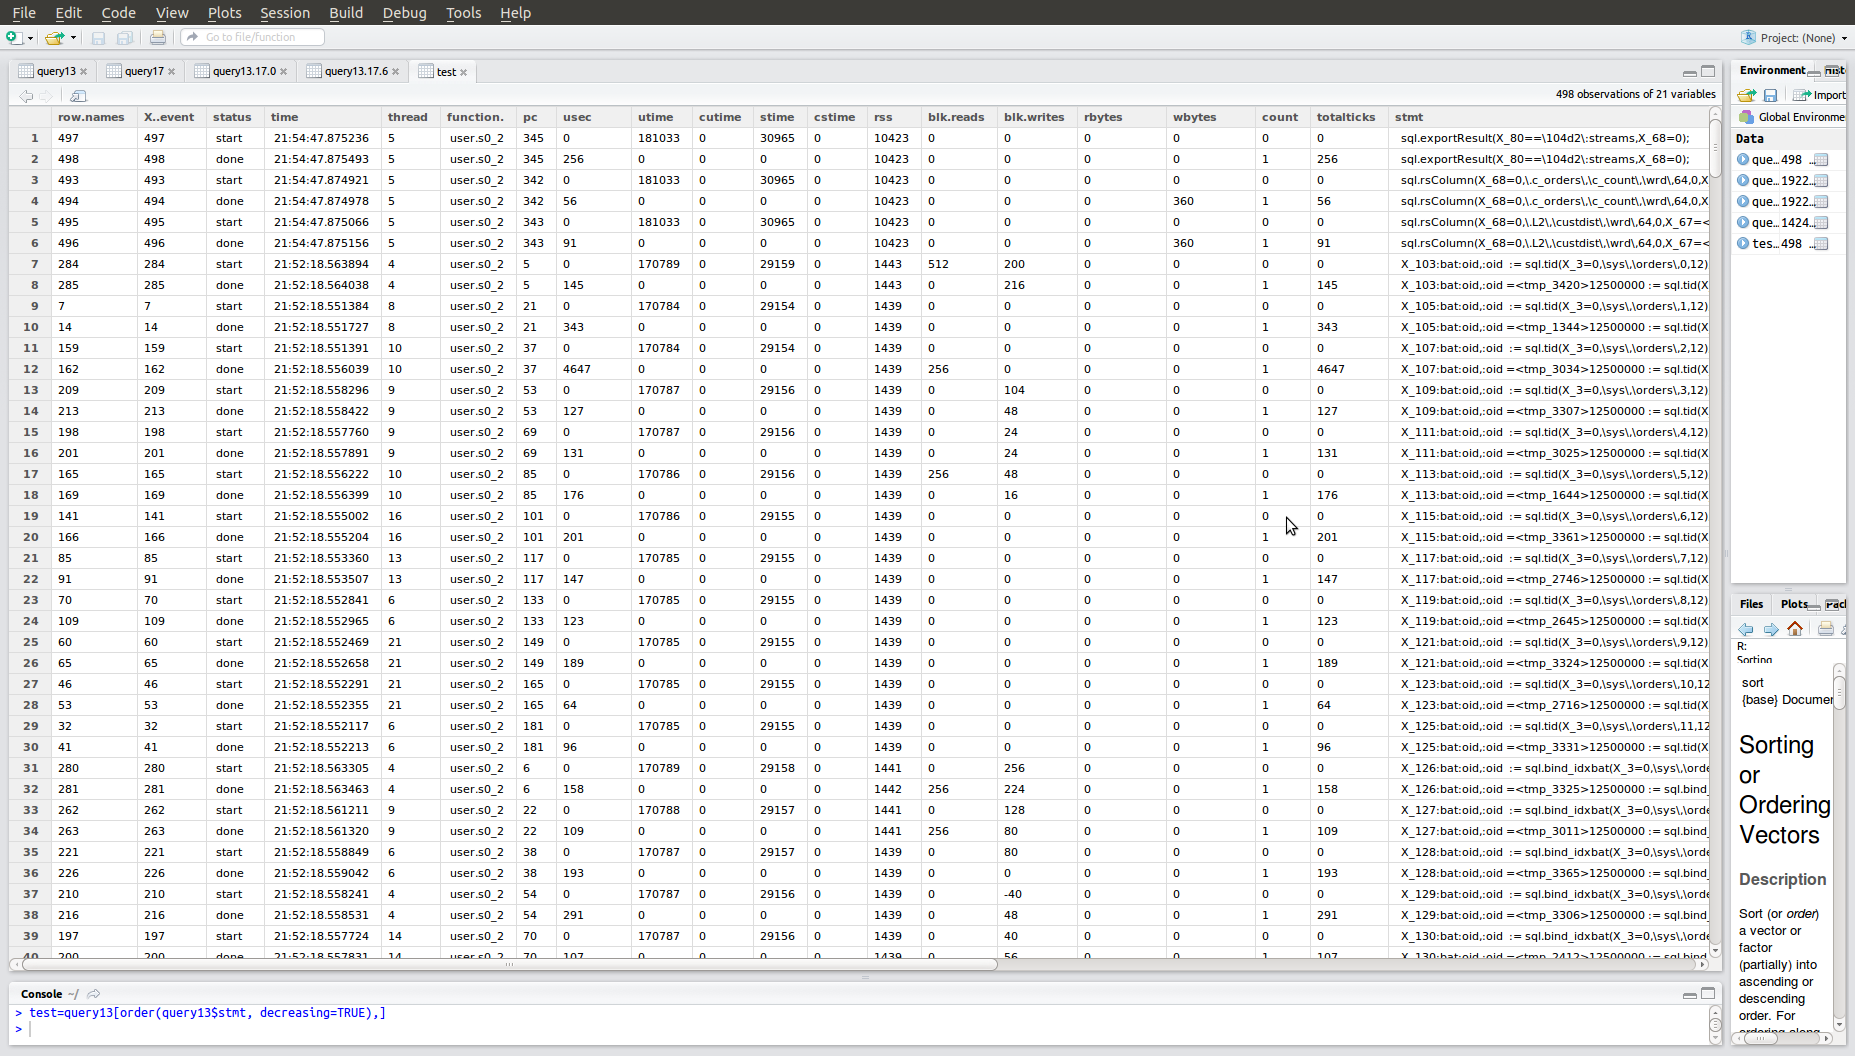
此测量是通过以下跟踪选项:+SatefiITcmrwbsy启用的,该选项将在在线文档下面解释。我不太清楚它们的含义。
The trace options (default 'ISTest'):
  S = monitor start of instruction profiling
  a = aggregate clock ticks per instruction
  e = event counter
  f = module.function name
  i = instruction counter
  I = interpreter thread number
  T = wall clock time
  t = ticks in microseconds
  c = cpu statistics (utime,ctime,stime,cstime)
  m = memory resources as provided by OS
  r = block reads
  w = block writes
  b = bytes read/written
  s = MAL statement
  y = MAL argument types
  p = process statistics, e.g. page faults, context switches
  u = user id
  D = Generate dot file upon query start
F = Dataflow memory claims回答 2
Stack Overflow用户
回答已采纳
发布于 2014-09-09 05:58:02
这些标记与Linux内核分析结构条目相关。见times(2)命令
类似的备注是针对从rusage系统调用中提取的io计数。每一次调用中处理的内存系统估计为r字节/w字节。
为了便于以后的操作,布局应该是规则的结构。
Stack Overflow用户
发布于 2014-09-09 05:55:51
这些标记与Linux内核分析结构条目相关。见times(2)命令
为了便于以后的操作,布局应该是规则的结构。
页面原文内容由Stack Overflow提供。腾讯云小微IT领域专用引擎提供翻译支持
原文链接:
https://stackoverflow.com/questions/24077439
复制相关文章
相似问题
腾讯云开发者

Copyright © 2013 - 2026 Tencent Cloud. All Rights Reserved. 腾讯云 版权所有
深圳市腾讯计算机系统有限公司 ICP备案/许可证号:粤B2-20090059  粤公网安备44030502008569号
腾讯云计算(北京)有限责任公司 京ICP证150476号 | 京ICP备11018762号