
类似Matplotlib-Basemap的3D CartoPy
我是Python的新手,我有一个关于Cartopy能否在3D绘图中使用的问题。下面是一个使用matplotlibBasemap的示例。
import matplotlib.pyplot as plt
from mpl_toolkits.mplot3d import Axes3D
from mpl_toolkits.basemap import Basemap

m = Basemap(projection='merc',
            llcrnrlat=52.0,urcrnrlat=58.0,
            llcrnrlon=19.0,urcrnrlon=40.0,
            rsphere=6371200.,resolution='h',area_thresh=10)

fig = plt.figure()
ax = Axes3D(fig)
ax.add_collection3d(m.drawcoastlines(linewidth=0.25))
ax.add_collection3d(m.drawcountries(linewidth=0.35))
ax.add_collection3d(m.drawrivers(color='blue'))

ax.set_xlabel('X')
ax.set_ylabel('Y')
ax.set_zlabel('Height')

fig.show()这将在三维轴内创建一张地图,这样您就可以在表面上绘制对象。但是使用Cartopy返回一个matplotlib.axes.GeoAxesSubplot。不清楚如何采取这一点,并添加到一个3D图形/轴,如上面使用matplotlib-basemap。
那么,有人能给出一些关于如何用Cartopy绘制类似的3D图的指点吗?
回答 1
Stack Overflow用户
发布于 2014-05-28 14:44:06
basemap mpl3d是一个相当巧妙的黑客,但它并没有按照描述的方式进行设计。因此,除了简单的海岸线之外,目前您不能在其他方面使用相同的技术。例如,充满活力的大陆就是不能工作。
也就是说,在使用cartopy时也可以使用类似的黑客攻击。由于我们可以一般地访问shapefile信息,所以这个解决方案应该适用于任何多行的shapefile,比如海岸线。
第一步是获取shapefile和相应的几何图形:
feature = cartopy.feature.NaturalEarthFeature('physical', 'coastline', '110m')
geoms = feature.geometries()
接下来,我们可以将这些转换为所需的投影:
target_projection = ccrs.PlateCarree()
geoms = [target_projection.project_geometry(geom, feature.crs)
         for geom in geoms]
由于这些是形状优美的几何图形,所以我们希望通过以下方法将它们转换为matplotlib路径:
from cartopy.mpl.patch import geos_to_path
import itertools

paths = list(itertools.chain.from_iterable(geos_to_path(geom)
                                             for geom in geoms))
使用路径,我们应该能够在matplotlib中创建一个PathCollection,并将其添加到轴中,但遗憾的是,Axes3D似乎无法处理PathCollection实例,因此我们需要通过构造LineCollection来解决这个问题(就像basemap那样)。遗憾的是,LineCollections不选择路径,而是分段,我们可以用:
segments = []
for path in paths:
vertices = [vertex for vertex, _ in path.iter_segments()]
vertices = np.asarray(vertices)
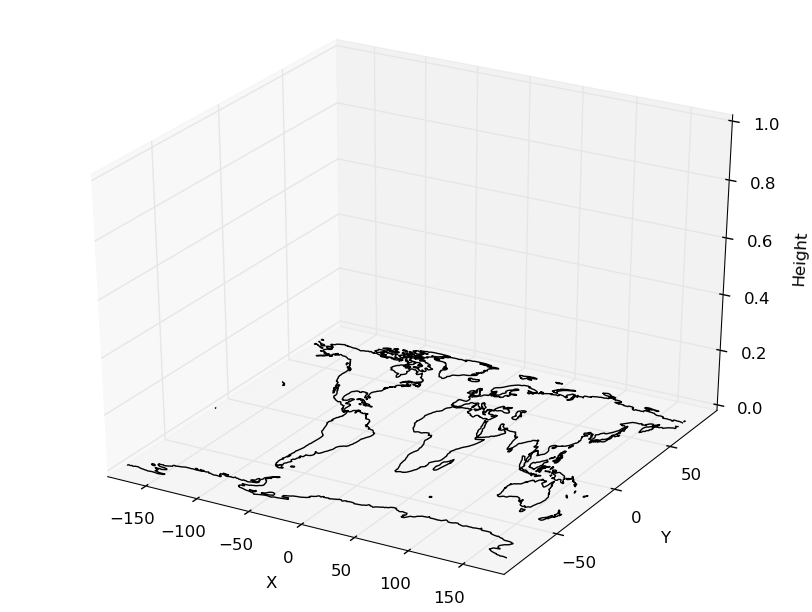
segments.append(vertices)将这一切结合在一起,我们得到的结果类似于您的代码生成的basemap图:
import itertools

from mpl_toolkits.mplot3d import Axes3D
import matplotlib.pyplot as plt
from matplotlib.collections import LineCollection
import numpy as np

import cartopy.feature
from cartopy.mpl.patch import geos_to_path
import cartopy.crs as ccrs


fig = plt.figure()
ax = Axes3D(fig, xlim=[-180, 180], ylim=[-90, 90])
ax.set_zlim(bottom=0)


target_projection = ccrs.PlateCarree()

feature = cartopy.feature.NaturalEarthFeature('physical', 'coastline', '110m')
geoms = feature.geometries()

geoms = [target_projection.project_geometry(geom, feature.crs)
         for geom in geoms]

paths = list(itertools.chain.from_iterable(geos_to_path(geom) for geom in geoms))

# At this point, we start working around mpl3d's slightly broken interfaces.
# So we produce a LineCollection rather than a PathCollection.
segments = []
for path in paths:
    vertices = [vertex for vertex, _ in path.iter_segments()]
    vertices = np.asarray(vertices)
    segments.append(vertices)

lc = LineCollection(segments, color='black')

ax.add_collection3d(lc)

ax.set_xlabel('X')
ax.set_ylabel('Y')
ax.set_zlabel('Height')

plt.show()
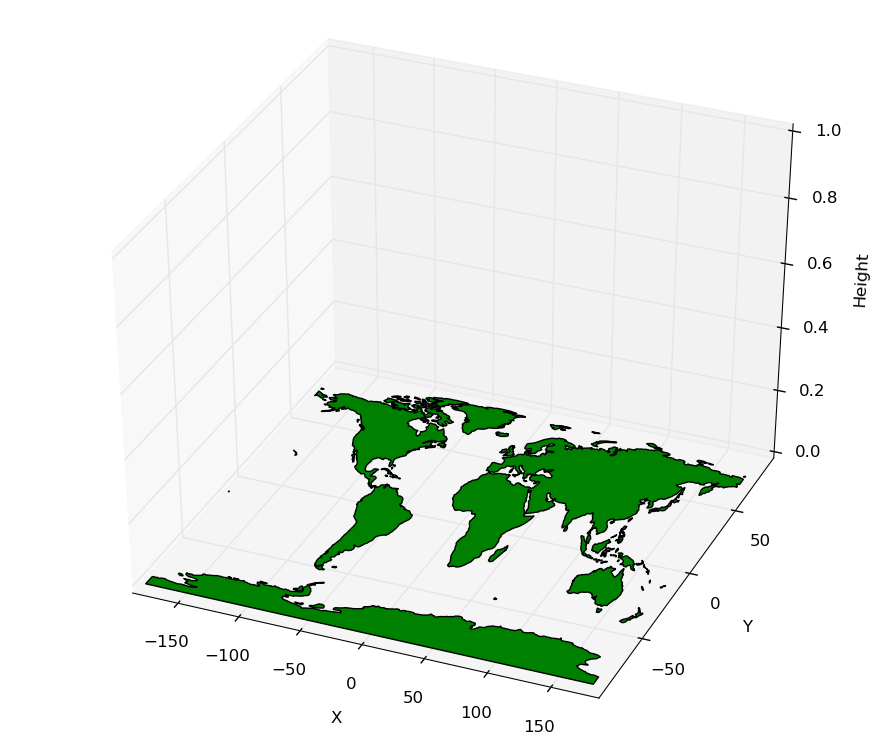
最重要的是,mpl3d似乎很好地处理了PolyCollection,这将是我要研究的填充几何学的路线,比如陆地轮廓(而不是严格意义上的海岸线)。
重要的一步是将路径转换为多边形,并在PolyCollection对象中使用这些路径:
concat = lambda iterable: list(itertools.chain.from_iterable(iterable))

polys = concat(path.to_polygons() for path in paths)
lc = PolyCollection(polys, edgecolor='black',
                    facecolor='green', closed=False)
本例的完整代码如下所示:
import itertools

from mpl_toolkits.mplot3d import Axes3D
import matplotlib.pyplot as plt
from matplotlib.collections import LineCollection, PolyCollection
import numpy as np

import cartopy.feature
from cartopy.mpl.patch import geos_to_path
import cartopy.crs as ccrs


fig = plt.figure()
ax = Axes3D(fig, xlim=[-180, 180], ylim=[-90, 90])
ax.set_zlim(bottom=0)


concat = lambda iterable: list(itertools.chain.from_iterable(iterable))

target_projection = ccrs.PlateCarree()

feature = cartopy.feature.NaturalEarthFeature('physical', 'land', '110m')
geoms = feature.geometries()

geoms = [target_projection.project_geometry(geom, feature.crs)
         for geom in geoms]

paths = concat(geos_to_path(geom) for geom in geoms)

polys = concat(path.to_polygons() for path in paths)

lc = PolyCollection(polys, edgecolor='black',
                    facecolor='green', closed=False)

ax.add_collection3d(lc)

ax.set_xlabel('X')
ax.set_ylabel('Y')
ax.set_zlabel('Height')

plt.show()
屈服:
https://stackoverflow.com/questions/23785408
复制相似问题
腾讯云开发者

Copyright © 2013 - 2026 Tencent Cloud. All Rights Reserved. 腾讯云 版权所有
深圳市腾讯计算机系统有限公司 ICP备案/许可证号:粤B2-20090059 ![]() 粤公网安备44030502008569号
粤公网安备44030502008569号
腾讯云计算(北京)有限责任公司 京ICP证150476号 | 京ICP备11018762号