
R闪亮/R Studio + rMaps的KML网络
R闪亮/R Studio + rMaps的KML网络
提问于 2014-05-13 17:27:16
这是对这里贴出的问题的跟进。
使用杰达里森开发的代码和讨论这里,下面是一个最小的ui.R:
library(shiny);library(rCharts)
shinyUI(fluidPage(
mainPanel(
  tabPanel("Interactive", tags$style('.leaflet {height: 1000px;}'),
  showOutput('mapPlot', 'leaflet'))
  ))              )
和最起码的服务器。
library(shiny);library(rCharts);library(rMaps)
shinyServer(function(input, output,session) {
  output$mapPlot <- renderMap({
    map1 = Leaflet$new()
    map1$setView(c(45.5236, -122.675), 13)
    map1$tileLayer("http://{s}.tile.openstreetmap.org/{z}/{x}/{y}.png")
    map1$addAssets(css = NULL, jshead = 'http://harrywood.co.uk/maps/examples/leaflet/leaflet-plugins/layer/vector/KML.js')
    map1$addKML('leaflet/placemark.kml')
    leafletLib <- file.path(find.package("rMaps"), "libraries", "leaflet")
    sampleKml <- readLines('http://kml-samples.googlecode.com/svn/trunk/kml/Placemark/placemark.kml')
    write(sampleKml, file.path(leafletLib, 'placemark.kml'))
    map1
}) })当我使用shiny::runApp()在服务器上运行RStudio或在一个实时网站上运行时,我会得到一个空白地图,类似于前面提到的解决方案之前我在本地遇到的问题。
我确信这与KML文件的位置以及文件权限有关,但我很难让它与KML文件一起工作。
感谢您提供的任何建议或资源。
更新:我在本地尝试并得到了相同的结果。所以,我不确定这和我的服务器联网有关.
回答 1
Stack Overflow用户
回答已采纳
发布于 2014-05-13 18:24:03
这里有几个问题。当它们都加载时,rCharts会重写rMaps。因此,Leaflet$new调用实际上来自rCharts包。此外,不可能使用以前使用的addAssets方法。有必要更改libraries/leaflet/config.yml文件并添加一个leaflet-kml.js链接。还必须将该文件下载到libraries/leaflet/external/leaflet-kml.js。
首先,我们将插件添加到rcharts传单javascript文件中。
require(yaml)
leafletLib <- file.path(find.package("rCharts"), "libraries", "leaflet")
rMapsConfig <- yaml.load_file(file.path(leafletLib, "config.yml"))
# add a kml library
kmlLib <- readLines("http://harrywood.co.uk/maps/examples/leaflet/leaflet-plugins/layer/vector/KML.js")
write(kmlLib, file.path(leafletLib, "external", "leaflet-kml.js"))
# add the library to config.yml
rMapsConfig$leaflet$jshead <- union(rMapsConfig$leaflet$jshead , "external/leaflet-kml.js")
write(as.yaml(rMapsConfig), file.path(leafletLib, "config.yml"))
现在我们可以用发亮的
library(shiny)
library(rCharts)
library(rMaps)
runApp(
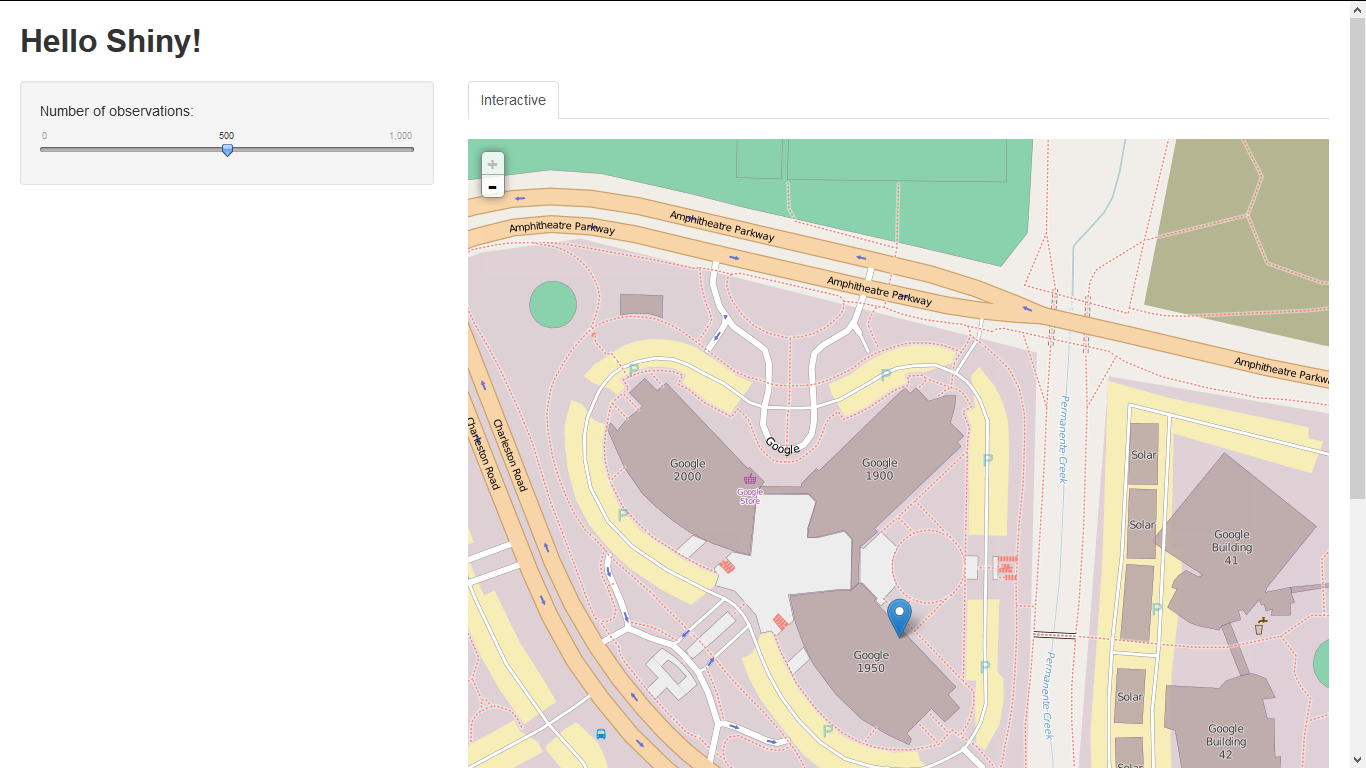
list(ui =fluidPage(
titlePanel("Hello Shiny!"),
sidebarLayout(
sidebarPanel(
sliderInput("obs", "Number of observations:", min = 0, max = 1000, value = 500)
),
mainPanel(
tabsetPanel(
tabPanel("Interactive", tags$style('.leaflet {height: 1000px;}'),
showOutput('mapPlot', 'leaflet'))
)
)
)
),
server = function(input, output,session) {
output$mapPlot <- renderUI({
map1 = Leaflet$new()
map1$setView(c(45.5236, -122.675), 13)
map1$tileLayer("http://{s}.tile.openstreetmap.org/{z}/{x}/{y}.png")
map1$addKML('leaflet/placemark.kml')
leafletLib <- file.path(find.package("rCharts"), "libraries", "leaflet")
sampleKml <- readLines('http://kml-samples.googlecode.com/svn/trunk/kml/Placemark/placemark.kml')
write(sampleKml, file.path(leafletLib, 'placemark.kml'))
HTML(map1$html(chartId = "mapPlot"))})
})
)
页面原文内容由Stack Overflow提供。腾讯云小微IT领域专用引擎提供翻译支持
原文链接:
https://stackoverflow.com/questions/23637902
复制相关文章
相似问题
腾讯云开发者

Copyright © 2013 - 2026 Tencent Cloud. All Rights Reserved. 腾讯云 版权所有
深圳市腾讯计算机系统有限公司 ICP备案/许可证号:粤B2-20090059 ![]() 粤公网安备44030502008569号
粤公网安备44030502008569号
腾讯云计算(北京)有限责任公司 京ICP证150476号 | 京ICP备11018762号