
按年份分组的地块数据
我试图绘制一个温度图,但我不能按年汇总数据。我的数据来源于以下表格:
02-2012 7.2
02-2013 7.2
02-2010 7.9
02-2011 9.8
03-2013 10.7
03-2010 13.1
03-2012 18.5
03-2011 13.7
02-2003 9.2
...
包含2000年1月至2013年12月期间的所有月份。我已经把数据载入动物园了:
f <- function(x) as.yearmon(format(x), "%m-%Y")
temp <- read.zoo(file="results.tsv", FUN = f)
绘制温度变量我得到了一个图,X轴从2000年1月到2013年12月,但我想要的是一个图,其中X轴从一月到十二月,每年的温度被绘制成一条单独的线。有什么暗示吗?
谢谢你,安德里亚
回答 2
Stack Overflow用户
发布于 2014-04-29 13:22:36
首先,您需要将日期分离到它的年份和月份组件中:
names(temp) <- c("date","temperature")
tmpSplit <- strsplit(temp$date, "-")
temp$month <- sapply(tmpSplit, "[", 1)
temp$year <- sapply(tmpSplit, "[", 2)
然后,我倾向于使用ggplot2包来绘制数据:
library(ggplot2)
ggplot(temp, aes(x=month, y=temperature, group=year)) + geom_line()Stack Overflow用户
发布于 2014-04-30 04:00:35
以下是几种方法。首先设置数据。注意read.zoo中的简化。
library(zoo)
temp <- read.zoo("results.tsv", FUN = as.yearmon, format = "%m-%Y")
除了下面的图,在R (stats包)的基础上还有monthplot。如果as.ts(temp)是问题中提供的数据的子集,那么它似乎不适用于temp,但是如果实际数据看起来更像?monthplot示例中的数据,那么它就会工作。
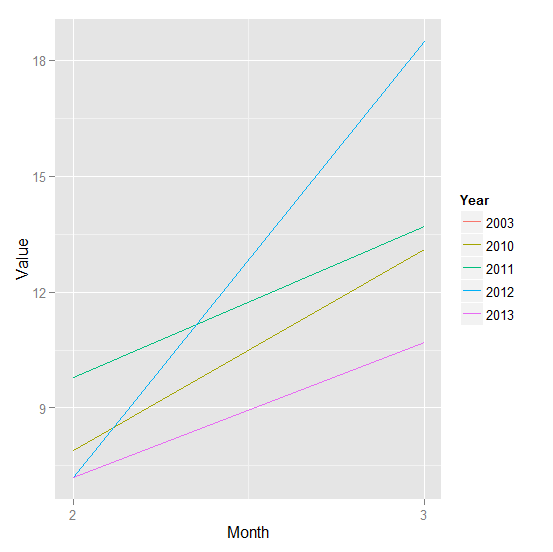
1) ggplot2
创建一个包含月份、年份和值列的data.frame DF。cycle可以得到月号和格式,用%Y格式可以给出年数。请注意,由于格式是字符,我们希望年份成为数据框架使其成为的一个因素。最后,使用ggplot2或格创建绘图:
library(ggplot2)
DF <- data.frame(Month = coredata(cycle(temp)),
                 Year = format(index(temp), "%Y"),
                 Value = coredata(temp))

ggplot(DF, aes(Month, Value, col = Year)) +
           geom_line() +
           scale_x_continuous(breaks = 1:12)
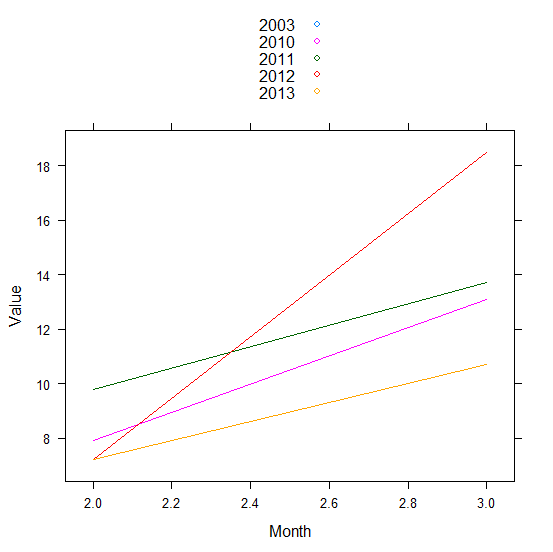
2)具有DF的格子(从2)这将起作用:
library(lattice)
xyplot(Value ~ Month, DF, group = Year, type = "l", auto = TRUE)
修改了,增加了解决方案和附加评论。
https://stackoverflow.com/questions/23365725
复制相似问题
腾讯云开发者

Copyright © 2013 - 2026 Tencent Cloud. All Rights Reserved. 腾讯云 版权所有
深圳市腾讯计算机系统有限公司 ICP备案/许可证号:粤B2-20090059  粤公网安备44030502008569号
腾讯云计算(北京)有限责任公司 京ICP证150476号 | 京ICP备11018762号