
多图图
多图图
提问于 2014-04-22 07:23:36
我想制作一个类似于以下情节的情节:
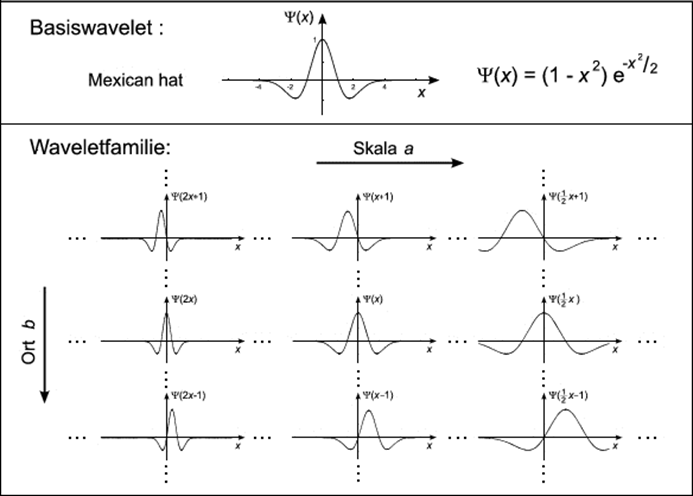
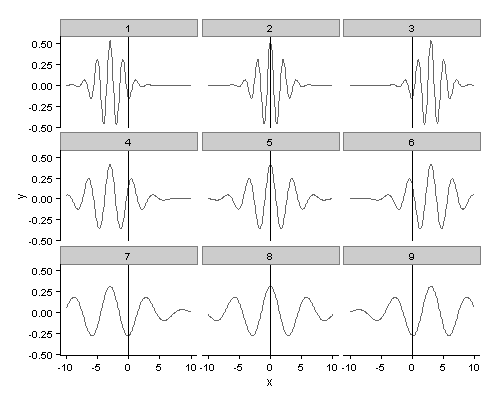
这是一个情节,显示了“方言”和“翻译”的一个函数称为小波。这里的函数并不重要,但是我是如何生成这样一个图的。
有人能给我一个提示吗?最好的方法是什么?我怎样才能得到图中的六坐标呢?我应该从par(mfrow=c(3,3))开始吗
到目前为止,我已经用以下代码来处理这个问题:
mo<-function(t,trans=0,omega=6,j=0){
  dial<-2*2^(j*.125)
  sqrt((1/dial))*pi^(-1/4)*exp(1i*omega*((t-trans)/dial))*exp(-((t-trans)/dial)^2/2)
}

par(mfrow=c(3,3))

plot(seq(-10,10,length=1000),Re(mo(seq(-10,10,length=1000),trans=-3)),axes=F,xlab="",ylab="",type="l")
abline(h=0,v=0)

plot(seq(-10,10,length=1000),Re(mo(seq(-10,10,length=1000),trans=0)),axes=F,xlab="",ylab="",type="l")
abline(h=0,v=0)

plot(seq(-10,10,length=1000),Re(mo(seq(-10,10,length=1000),trans=3)),axes=F,xlab="",ylab="",type="l")
abline(h=0,v=0)


#############

plot(seq(-10,10,length=1000),Re(mo(seq(-10,10,length=1000),trans=-3,j=6)),axes=F,xlab="",ylab="",type="l")
abline(h=0,v=0)

plot(seq(-10,10,length=1000),Re(mo(seq(-10,10,length=1000),trans=0,j=6)),axes=F,xlab="",ylab="",type="l")
abline(h=0,v=0)

plot(seq(-10,10,length=1000),Re(mo(seq(-10,10,length=1000),trans=3,j=6)),axes=F,xlab="",ylab="",type="l")
abline(h=0,v=0)
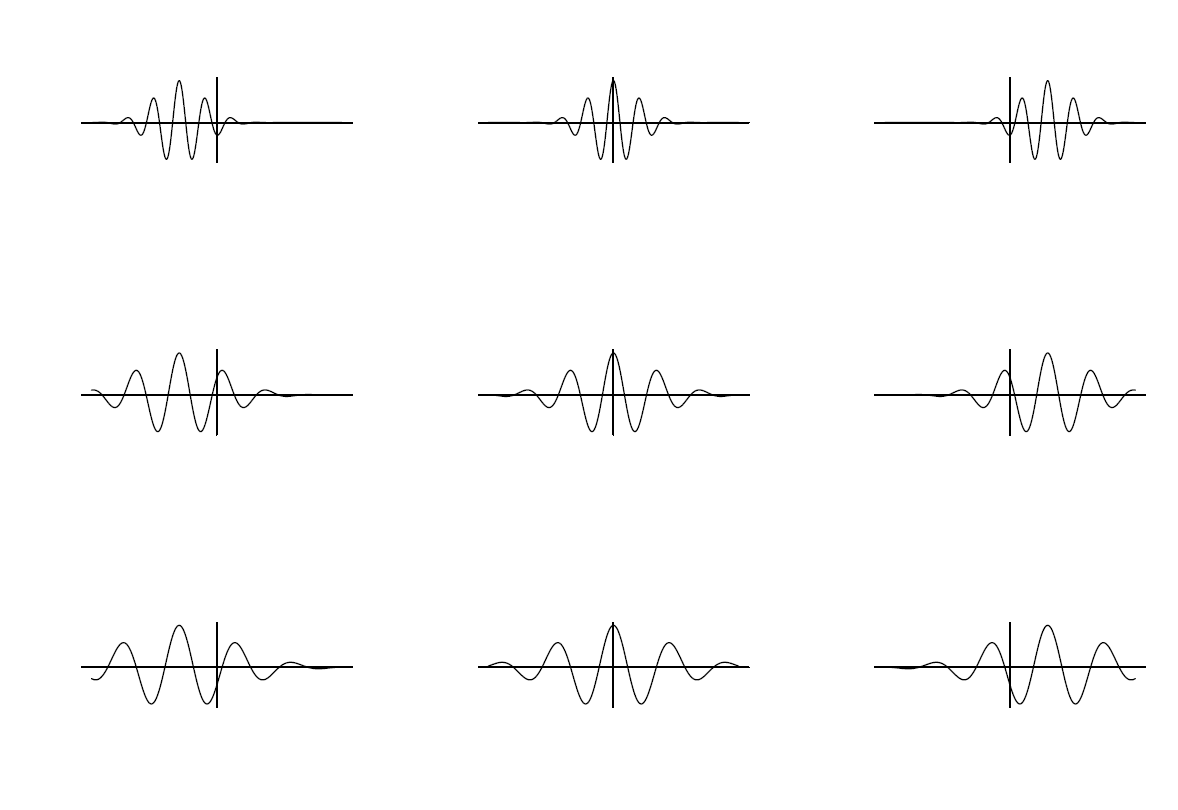
但这仍然不是我需要的
回答 2
Stack Overflow用户
回答已采纳
发布于 2014-04-22 09:23:24
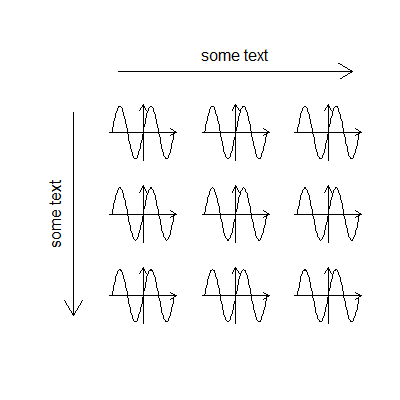
下面是一种使用layout创建特定布局的解决方案,在左侧和顶部为长箭头添加额外的面板
par(mar=c(1,1,1,1), oma=c(5,4,4,2))
m = matrix( c(0, 1, 1, 1,
              2, 3, 4, 5,
              2, 6, 7, 8,
              2, 9, 10, 11),
        byrow=T, ncol=4)
l = layout(mat=m, widths=c(.1, .2, .2, .2), heights= c(.1, .2, .2, .2))

# check if the layout is as we expect
layout.show(l)

# add top arrow to panel 1
plot(1, xlim=c(1,10), ylim=c(0,1), type='n', axes=F, ann=F)
arrows(x0=1, x1=10, y0=0.5, y1=0.5)
mtext(side=3,'some text')
# add left arrow to panel 2
plot(1, xlim=c(0,1), ylim=c(1,10), type='n', axes=F, ann=F)
arrows(y0=10, y1=1, x0=0.5, x1=0.5)
mtext(side=2,'some text')

# add plots to panels 3:11
for (i in 1:9){

    curve(sin(x), -2*pi, 2*pi, axes=F, ann=F)

    # get x and y extents of plot for drawing arrows
    ymax = par('usr')[4]
    ymin = par('usr')[3]
    xmax = par('usr')[2]
    xmin = par('usr')[1]
    arrows(x0=0, y0=ymin, x1=0, y1=ymax, length=0.1)
    arrows(x0=xmin, y0=0, x1=xmax, y1=0, length=0.1)
}
Stack Overflow用户
发布于 2014-04-22 08:34:49
我会从这样的开始:
fmo<-function(t,trans=0,omega=6,j=0){
  dial<-2*2^(j*.125)
  sqrt((1/dial))*pi^(-1/4)*exp(1i*omega*((t-trans)/dial))*exp(-((t-trans)/dial)^2/2)
}

dat <- expand.grid(x=seq(-10,10, length = 200),
               trans = c(-3,0,3),
               j = c(0, 6, 12))
dat$g <- rep(1:9, each = 200)
dat$y <- with(dat, Re(fmo(t=x,trans=trans,omega=6,j=j)))

library(ggplot2)
ggplot(dat) + geom_line(aes(x=x, y=y)) +
  facet_wrap(~g, ncol = 3)
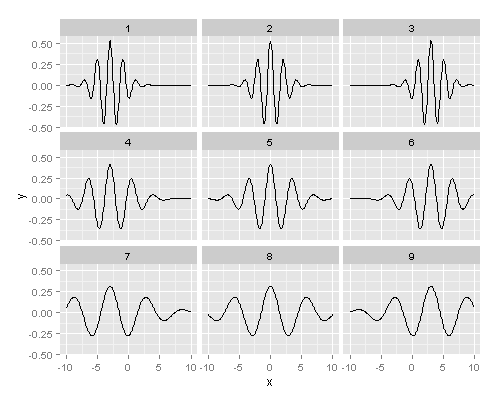
从这里开始用一些主题格式
ggplot(dat) + geom_line(aes(x=x, y=y)) +
  geom_vline(aes(xintercept=0)) +
  facet_wrap(~g, ncol = 3) +
  theme_classic()
页面原文内容由Stack Overflow提供。腾讯云小微IT领域专用引擎提供翻译支持
原文链接:
https://stackoverflow.com/questions/23213135
复制相关文章
相似问题
腾讯云开发者

Copyright © 2013 - 2026 Tencent Cloud. All Rights Reserved. 腾讯云 版权所有
深圳市腾讯计算机系统有限公司 ICP备案/许可证号:粤B2-20090059 ![]() 粤公网安备44030502008569号
粤公网安备44030502008569号
腾讯云计算(北京)有限责任公司 京ICP证150476号 | 京ICP备11018762号