
己宾和histogram2d的不同行为
己宾和histogram2d的不同行为
提问于 2014-04-10 13:58:12
己宾和histogram2d的区别是什么?
f, (ax1,ax2) = plt.subplots(2)
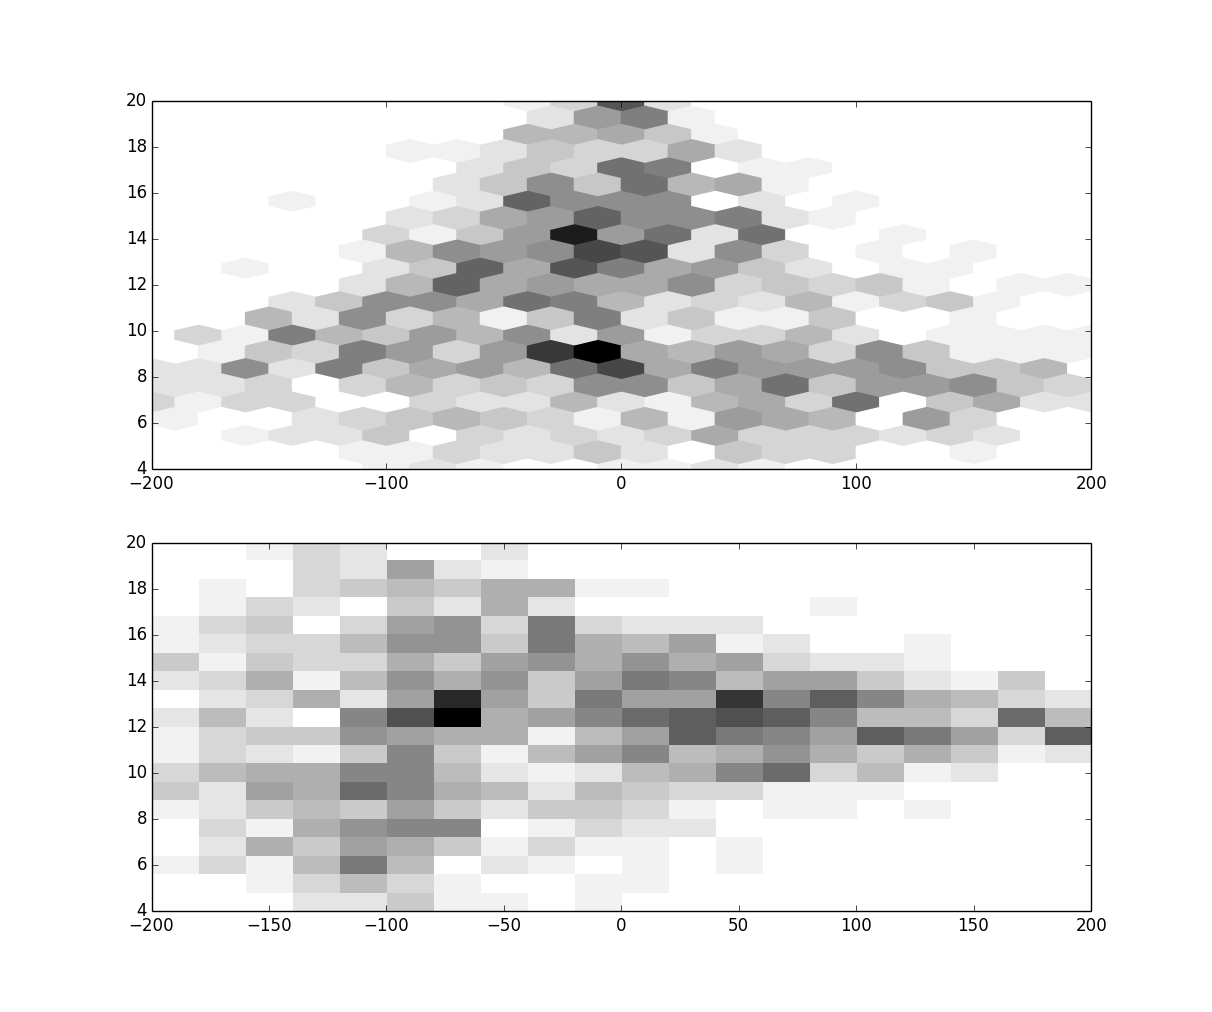
ax1.hexbin(vradsel[0], distsel[0],gridsize=20,extent=-200,200,4,20],cmap=plt.cm.binary)
H, xedges, yedges =np.histogram2d(vradsel[0], distsel[0],bins=20,range=[[-200,200],[4,20]])
ax2.imshow(H, interpolation='nearest', cmap=plt.cm.binary, aspect='auto',extent=[xedges[0],xedges[-1],yedges[0],yedges[-1]])
plt.show()你可以看到histogram2d给出了-90度的旋转.我知道数据应该和黑箱的情节一样。
回答 1
Stack Overflow用户
回答已采纳
发布于 2014-04-10 14:21:48
不同的不是直方图的计算方式,而是直方图的绘制方式。来自np.histogram的数组np.histogram从数组左上方的4, -200 bin开始,但将根据origin的默认值绘制。您可以使用origin=lower或origin=upper关键字在plt.imshow中控制这一点。
但是origin只是镜像图像,因此您还必须记住,在图像中,水平轴x优先,垂直轴y次之,与数组相反,因此在绘图之前还必须转置H。
我的建议是只使用plt.hist2d(),这将适当地调整范围和方向,就像plt.hexbin一样。您仍然可以像numpy版本:H, x, y, im = ax.hist2d(...)那样访问结果,但是它会自动生成绘图。
a = np.random.rand(100)*400 - 200
b = np.random.rand(100)*16 + 4
a[:10] = -200
b[:10] = 4
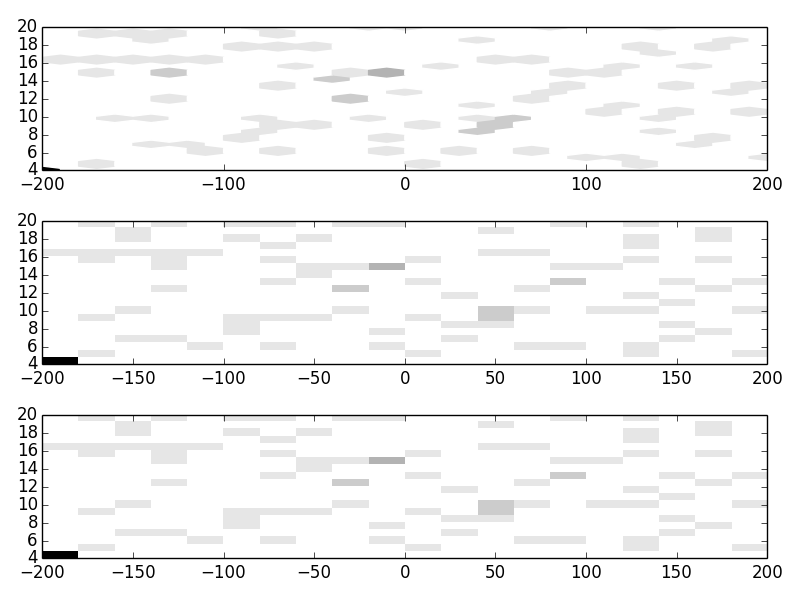
f, ax = plt.subplots(3)
ax[0].hexbin(a, b, gridsize=20, extent=[-200,200,4,20], cmap=plt.cm.binary)
H, xedges, yedges = np.histogram2d(a, b, bins=20, range=[[-200,200],[4,20]])
ax[1].imshow(H.T, interpolation='nearest', cmap=plt.cm.binary, aspect='auto',
extent=[xedges[0],xedges[-1],yedges[0],yedges[-1]], origin='lower')
# simplest and most reliable:
ax[2].hist2d(a, b, bins=20, range=[[-200,200],[4,20]], cmap=plt.cm.binary)
页面原文内容由Stack Overflow提供。腾讯云小微IT领域专用引擎提供翻译支持
原文链接:
https://stackoverflow.com/questions/22990192
复制相关文章
相似问题
腾讯云开发者

Copyright © 2013 - 2026 Tencent Cloud. All Rights Reserved. 腾讯云 版权所有
深圳市腾讯计算机系统有限公司 ICP备案/许可证号:粤B2-20090059 ![]() 粤公网安备44030502008569号
粤公网安备44030502008569号
腾讯云计算(北京)有限责任公司 京ICP证150476号 | 京ICP备11018762号