
更好的解决方案?
更好的解决方案?
提问于 2014-04-03 11:17:41
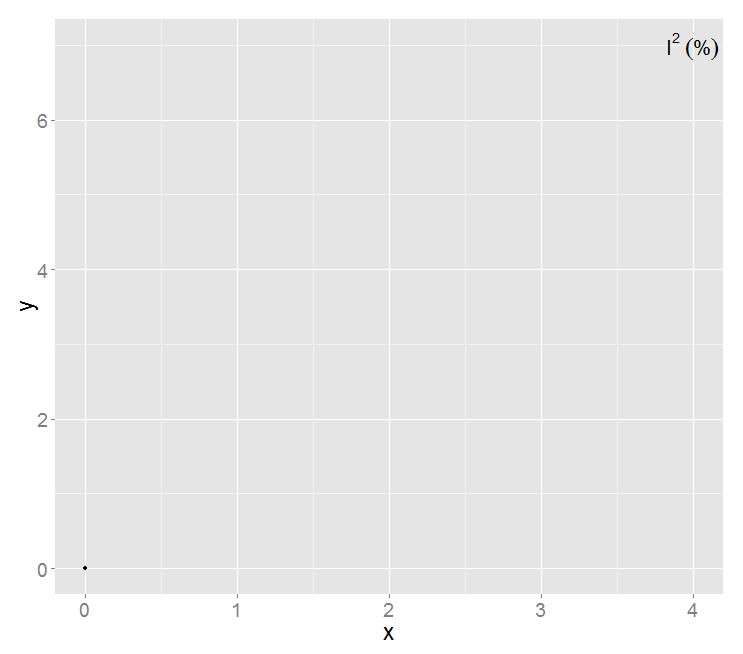
我有以下代码
     standard_text = "(%)"
    plotmath_text <- "I^2"
    g <- ggplot(data=data.frame(x=0,y=0))+geom_point(aes(x=x,y=y))
g+ annotate("text", x = 4.3, y = 6.97, label =standard_text)+
 annotate("text",x = 4, y = 7, cex = 7, label = plotmath_text,parse = TRUE )
生成一个图形,其中右上角有注释。
I^2 (%)
是否有任何方法可以使用一次而不是两次注释命令来创建相同的注释?我尝试将它们合并到那一页之后的一个命令中,但是我总是收到错误。
回答 1
页面原文内容由Stack Overflow提供。腾讯云小微IT领域专用引擎提供翻译支持
原文链接:
https://stackoverflow.com/questions/22835939
复制相关文章
相似问题
腾讯云开发者

Copyright © 2013 - 2026 Tencent Cloud. All Rights Reserved. 腾讯云 版权所有
深圳市腾讯计算机系统有限公司 ICP备案/许可证号:粤B2-20090059 ![]() 粤公网安备44030502008569号
粤公网安备44030502008569号
腾讯云计算(北京)有限责任公司 京ICP证150476号 | 京ICP备11018762号