
原型地图上的标记点
原型地图上的标记点
提问于 2014-03-21 16:42:27
如何从原型包中向原型地图添加标签?或者,是否有可能在ggplot中重新创建拱形图输出?
使用SportsAnalytics演示程序中的代码(希望这不是糟糕的形式)
library("SportsAnalytics")
library("archetypes")
data("NBAPlayerStatistics0910")
dat <- subset(NBAPlayerStatistics0910,
select = c(Team, Name, Position,
TotalMinutesPlayed, FieldGoalsMade))
mat <- as.matrix(subset(dat, select = c(TotalMinutesPlayed, FieldGoalsMade)))
a3 <- archetypes(mat, 3)
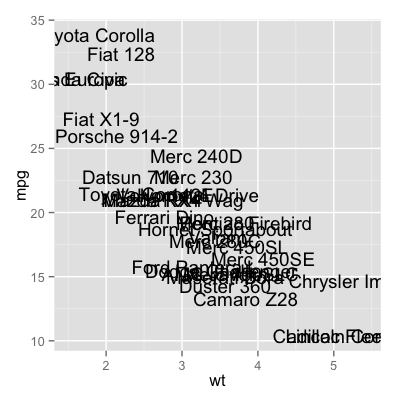
archmap(a3)我想要球员的名字(NBAPlayerStatistics0910 s0910美元名称)在图表上的点数。类似于下面,但更易读。
回答 1
Stack Overflow用户
回答已采纳
发布于 2014-03-21 17:16:16
如果您不介意稍微调整一下,可以从archmap()函数库开始,添加一个额外的参数并添加一个text()调用:
amap2 <- function (object, a.names, projection = simplex_projection, projection_args = list(),
          rotate = 0, cex = 1.5, col = 1, pch = 1, xlab = "", ylab = "",
          axes = FALSE, asp = TRUE, ...)
{
  stopifnot("archetypes" %in% class(object))
  stopifnot(is.function(projection))
  k <- object$k
  if (k < 3) {
    stop("Need at least 3 archetypes.\n")
  }
  cmds <- do.call(projection, c(list(parameters(object)), projection_args))
  if (rotate != 0) {
    a <- pi * rotate/180
    A <- matrix(c(cos(a), -sin(a), sin(a), cos(a)), ncol = 2)
    cmds <- cmds %*% A
  }
  hmds <- chull(cmds)
  active <- 1:k %in% hmds
  plot(cmds, type = "n", xlab = xlab, ylab = ylab, axes = axes,
       asp = asp, ...)
  points(coef(object) %*% cmds, col = col, pch = pch)

  ######################
  # PLAY WITH THIS BIT #
  ######################
  text(coef(object) %*% cmds, a.names, pos=4)
  ######################

  rad <- ceiling(log10(k)) + 1.5
  polygon(cmds[hmds, ])
  points(cmds[active, ], pch = 21, cex = rad * cex, bg = "grey")
  text(cmds[active, ], labels = (1:k)[active], cex = cex)
  if (any(!active)) {
    points(cmds[!active, , drop = FALSE], pch = 21, cex = rad *
             cex, bg = "white", fg = "grey")
    text(cmds[!active, , drop = FALSE], labels = (1:k)[!active],
         cex = cex, col = "grey20")
  }
  invisible(cmds)
}

amap2(a3, dat$Name)
显然,我的快速刺并不是你想要的最终结果,但它应该会帮助你上路(如果我读到了你想要做的事情)。

页面原文内容由Stack Overflow提供。腾讯云小微IT领域专用引擎提供翻译支持
原文链接:
https://stackoverflow.com/questions/22564541
复制相关文章
相似问题
腾讯云开发者

Copyright © 2013 - 2026 Tencent Cloud. All Rights Reserved. 腾讯云 版权所有
深圳市腾讯计算机系统有限公司 ICP备案/许可证号:粤B2-20090059 ![]() 粤公网安备44030502008569号
粤公网安备44030502008569号
腾讯云计算(北京)有限责任公司 京ICP证150476号 | 京ICP备11018762号