
在R中两个不同的x坐标的桶形图中添加一条线
在R中两个不同的x坐标的桶形图中添加一条线
提问于 2014-03-11 23:15:41
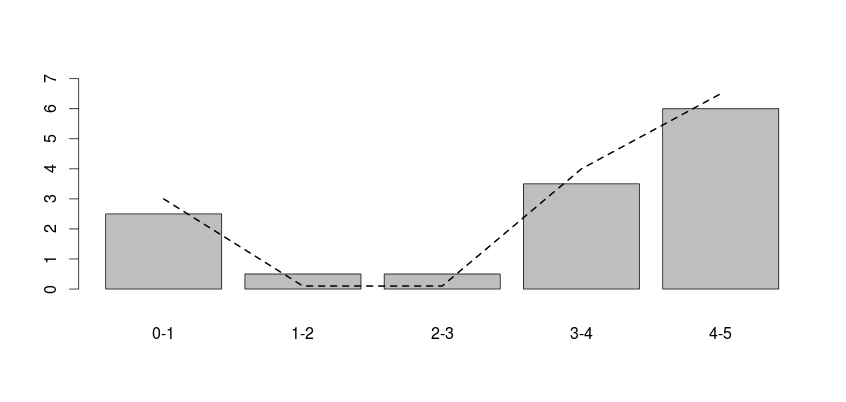
我有一个条形图,我想在这个条形图中添加一个图,但是根据x轴的不同比例值,我不能正确地做它。我希望第一条横过第一条,第二条穿过第二条和第三条,最后一条穿过第四条和第五条。我怎么才能在R里做到呢?我编写了以下代码:
   barplot(c(2.5, .5, .5, 3.5, 6), names.arg=c("0-1","1-2", "2-3", "3-4", "4-5"))
lines(c(1, 2, 3,4 ,5), c(3, .1, .1, 4, 6.5), lty=2, lwd=2)回答 1
Stack Overflow用户
回答已采纳
发布于 2014-03-12 00:00:32
理解你想要什么有点复杂..。我会尽力帮你做以下两件事:
- 绘制条形图的x值由函数barplot返回.因此,要在后一个情节中使用它们,只需将它们存储在
bp = barplot(...)并在调用lineslines(bp, y.data, ...)时使用它们 - 您会发现,不绘制条形图上方的部分行,因为在用barplot初始化视图时,默认情况下会裁剪y值。有几种可能的解决办法:
bp = barplot(..., ylim=range(data)+c(-1,1) ) # to set the y-limits during the call to barplot或者:lines(..., xpd=T) # to allow drawing in the plot margin
最后,下面显示了一个最小的工作示例:
data = c(2.5, .5, .5, 3.5, 6)
bp = barplot(data, names.arg=c("0-1","1-2", "2-3", "3-4", "4-5"),
             ylim = range(data)+c(-1,1) )
lines(bp, c(3, .1, .1, 4, 6.5), lty=2, lwd=2)
页面原文内容由Stack Overflow提供。腾讯云小微IT领域专用引擎提供翻译支持
原文链接:
https://stackoverflow.com/questions/22338709
复制相关文章
相似问题
腾讯云开发者

Copyright © 2013 - 2026 Tencent Cloud. All Rights Reserved. 腾讯云 版权所有
深圳市腾讯计算机系统有限公司 ICP备案/许可证号:粤B2-20090059 ![]() 粤公网安备44030502008569号
粤公网安备44030502008569号
腾讯云计算(北京)有限责任公司 京ICP证150476号 | 京ICP备11018762号