
geom_boxplot和geom_jitter
geom_boxplot和geom_jitter
提问于 2014-02-21 21:05:41
将数据点与方框图对齐。
数据:
data<-structure(list(score = c(0.058, 0.21, -0.111, -0.103, 0.051,
0.624, -0.023, 0.01, 0.033, -0.815, -0.505, -0.863, -0.736, -0.971,
-0.137, -0.654, -0.689, -0.126), clin = structure(c(1L, 1L, 1L,
1L, 1L, 2L, 1L, 1L, 1L, 2L, 2L, 2L, 2L, 2L, 1L, 2L, 2L, 1L), .Label =
c("Non-Sensitive",
"Sensitive "), class = "factor"), culture = structure(c(1L, 1L,
1L, 1L, 1L, 1L, 1L, 1L, 1L, 2L, 2L, 2L, 2L, 2L, 2L, 2L, 2L, 2L
), .Label = c("Co-culture", "Mono-culture"), class = "factor"),
    status = structure(c(2L, 2L, 1L, 2L, 2L, 1L, 2L, 2L, 1L,
    2L, 2L, 1L, 2L, 2L, 1L, 2L, 1L, 2L), .Label = c("new", "old"
    ), class = "factor")), .Names = c("score", "clin", "culture",
"status"), class = "data.frame", row.names = c(NA, -18L))
代码:
p<-ggplot(data, aes(culture, as.numeric(score),fill=status))

p+geom_boxplot(outlier.shape = NA)+
   theme_bw()+scale_fill_grey(start = 0.8, end = 1)+
   labs(title="title", x="", y="score",fill="", colour="")+
   geom_jitter(aes(colour = clin), alpha=0.9,
   position=position_jitter(w=0.1,h=0.1))

如您所见,使用geom_jitter绘制的数据点与方框图不对齐。我知道我也需要向geom_jitter提供aes元素,但我不知道如何正确地做到这一点。
回答 1
Stack Overflow用户
回答已采纳
发布于 2014-02-21 21:40:31
我不认为你能做到这一点,因为方格图的位置是由道奇算法驱动的,而不是一种明确的美学,不过我很好奇是否有人想出了一种方法。以下是一个解决办法:
p<-ggplot(data, aes(status, as.numeric(score),fill=status))
p+geom_boxplot(outlier.shape = NA)+
  theme_bw()+scale_fill_grey(start = 0.8, end = 1)+
  labs(title="title", x="", y="score",fill="", colour="")+
  geom_jitter(aes(colour = clin), alpha=0.9,
              position=position_jitter(w=0.1,h=0.1)) +
  facet_wrap(~ culture)
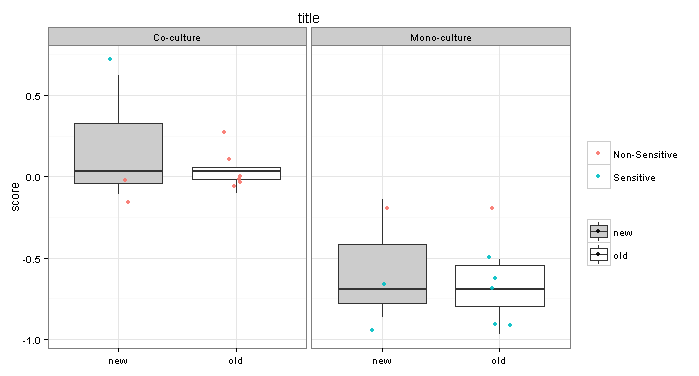
通过使用culture的面,我们可以为status指定一个显式的美学,然后允许将geom_jitter与geom_boxplot排列起来。希望这对你的目的来说已经足够接近了。
页面原文内容由Stack Overflow提供。腾讯云小微IT领域专用引擎提供翻译支持
原文链接:
https://stackoverflow.com/questions/21945156
复制相关文章
相似问题
腾讯云开发者

Copyright © 2013 - 2026 Tencent Cloud. All Rights Reserved. 腾讯云 版权所有
深圳市腾讯计算机系统有限公司 ICP备案/许可证号:粤B2-20090059 ![]() 粤公网安备44030502008569号
粤公网安备44030502008569号
腾讯云计算(北京)有限责任公司 京ICP证150476号 | 京ICP备11018762号