
Matplotlib日志刻度刻度标号标号格式
对于matplotlib,当为一个轴指定一个日志标度时,标记该轴的默认方法是用10到一个幂(例如)的数字。10^6.是否有一种简单的方法来改变所有这些标签成为它们的全部数字表示?例如:1、10、100等
请注意,我不知道权力的范围将是什么,并希望支持任意范围(包括负面)。
回答 5
Stack Overflow用户
发布于 2014-02-20 22:05:06
当然,只要改变格式化程序就行。
例如,如果我们有这样的情节:
import matplotlib.pyplot as plt

fig, ax = plt.subplots()
ax.axis([1, 10000, 1, 100000])
ax.loglog()

plt.show()
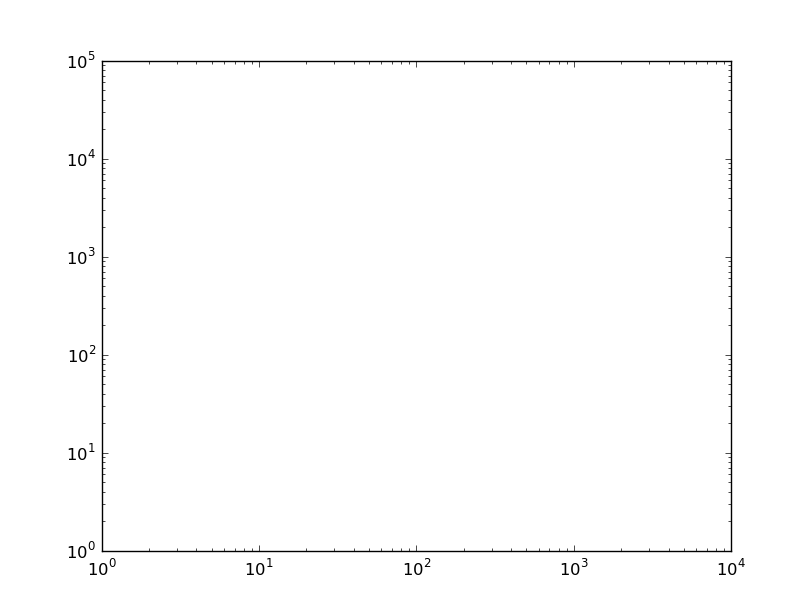
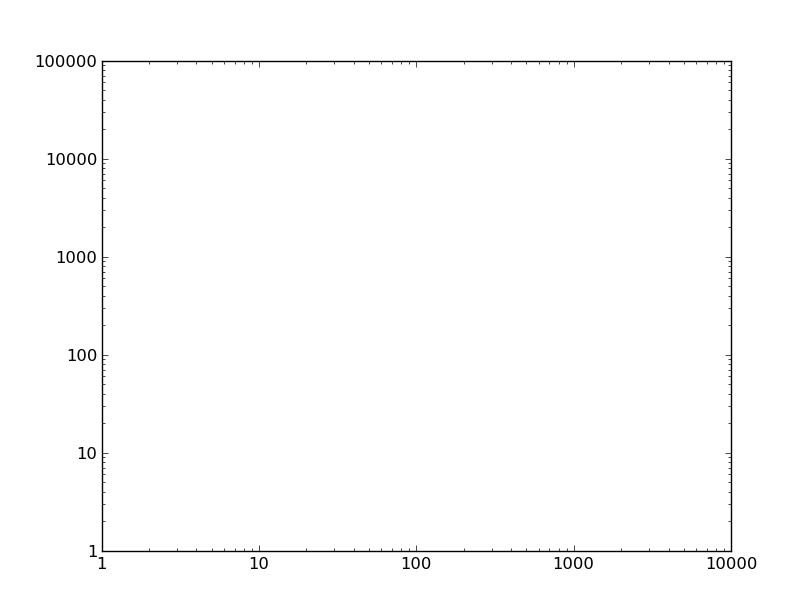
您可以手动设置滴答标签,但当缩放/平移/等时,滴答位置和标签将被修复。因此,最好更改格式化程序。默认情况下,对数刻度使用LogFormatter,它将以科学符号的形式格式化这些值。若要将格式化程序更改为线性轴(ScalarFormatter)的默认设置,请使用。
from matplotlib.ticker import ScalarFormatter
for axis in [ax.xaxis, ax.yaxis]:
    axis.set_major_formatter(ScalarFormatter())
Stack Overflow用户
发布于 2015-10-19 11:26:09
我已经发现,如果所有的滴答值都大于或等于1,那么使用ScalarFormatter是很好的。但是,如果您在数字<1上有一个滴答,ScalarFormatter会将滴答标签打印为0。
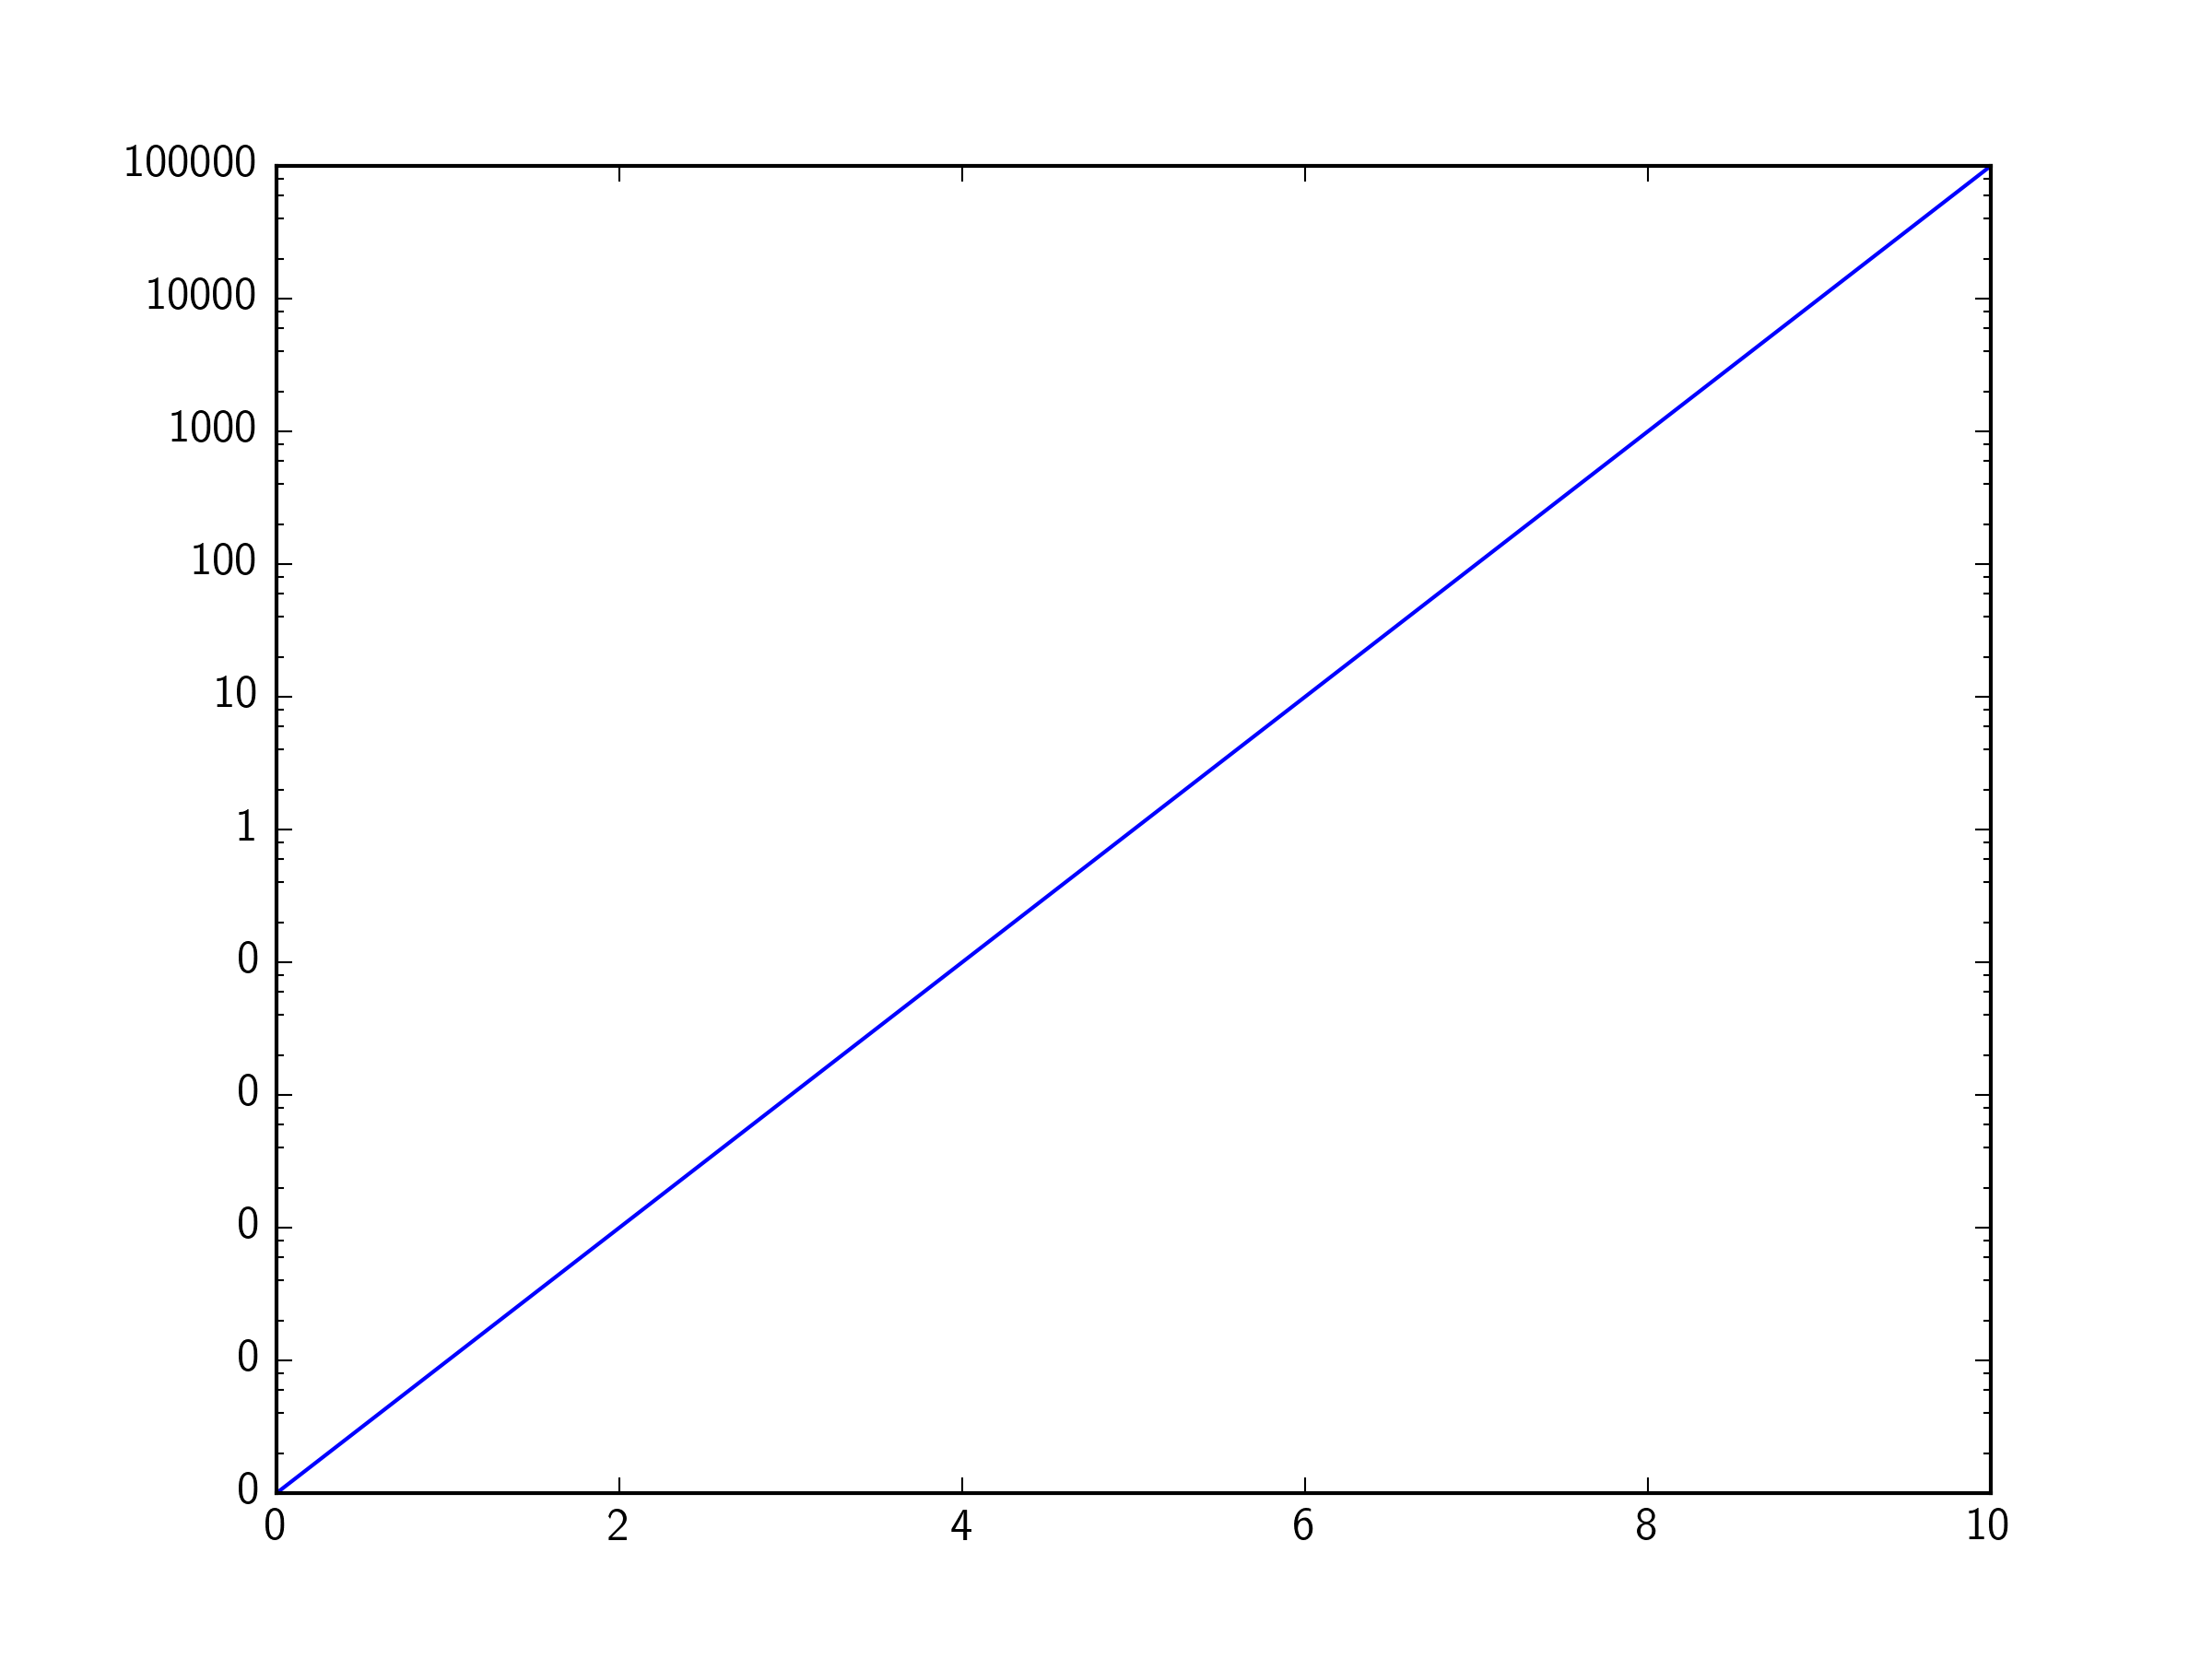
我们可以使用matplotlib FuncFormatter模块中的ticker来解决这个问题。最简单的方法是使用lambda函数和g格式说明符(感谢注释中的@lenz )。
import matplotlib.ticker as ticker

ax.yaxis.set_major_formatter(ticker.FuncFormatter(lambda y, _: '{:g}'.format(y)))注意,在我最初的回答中,我没有使用g格式,而是使用lambda函数FuncFormatter将数字>= 1设置为其整数值,数字<1设置为它们的十进制值,并设置所需的最小小数位数(例如,0.1, 0.01, 0.001等)。它假设您只设置base10值的刻度。
import matplotlib.ticker as ticker
import numpy as np

ax.yaxis.set_major_formatter(ticker.FuncFormatter(lambda y,pos: ('{{:.{:1d}f}}'.format(int(np.maximum(-np.log10(y),0)))).format(y)))
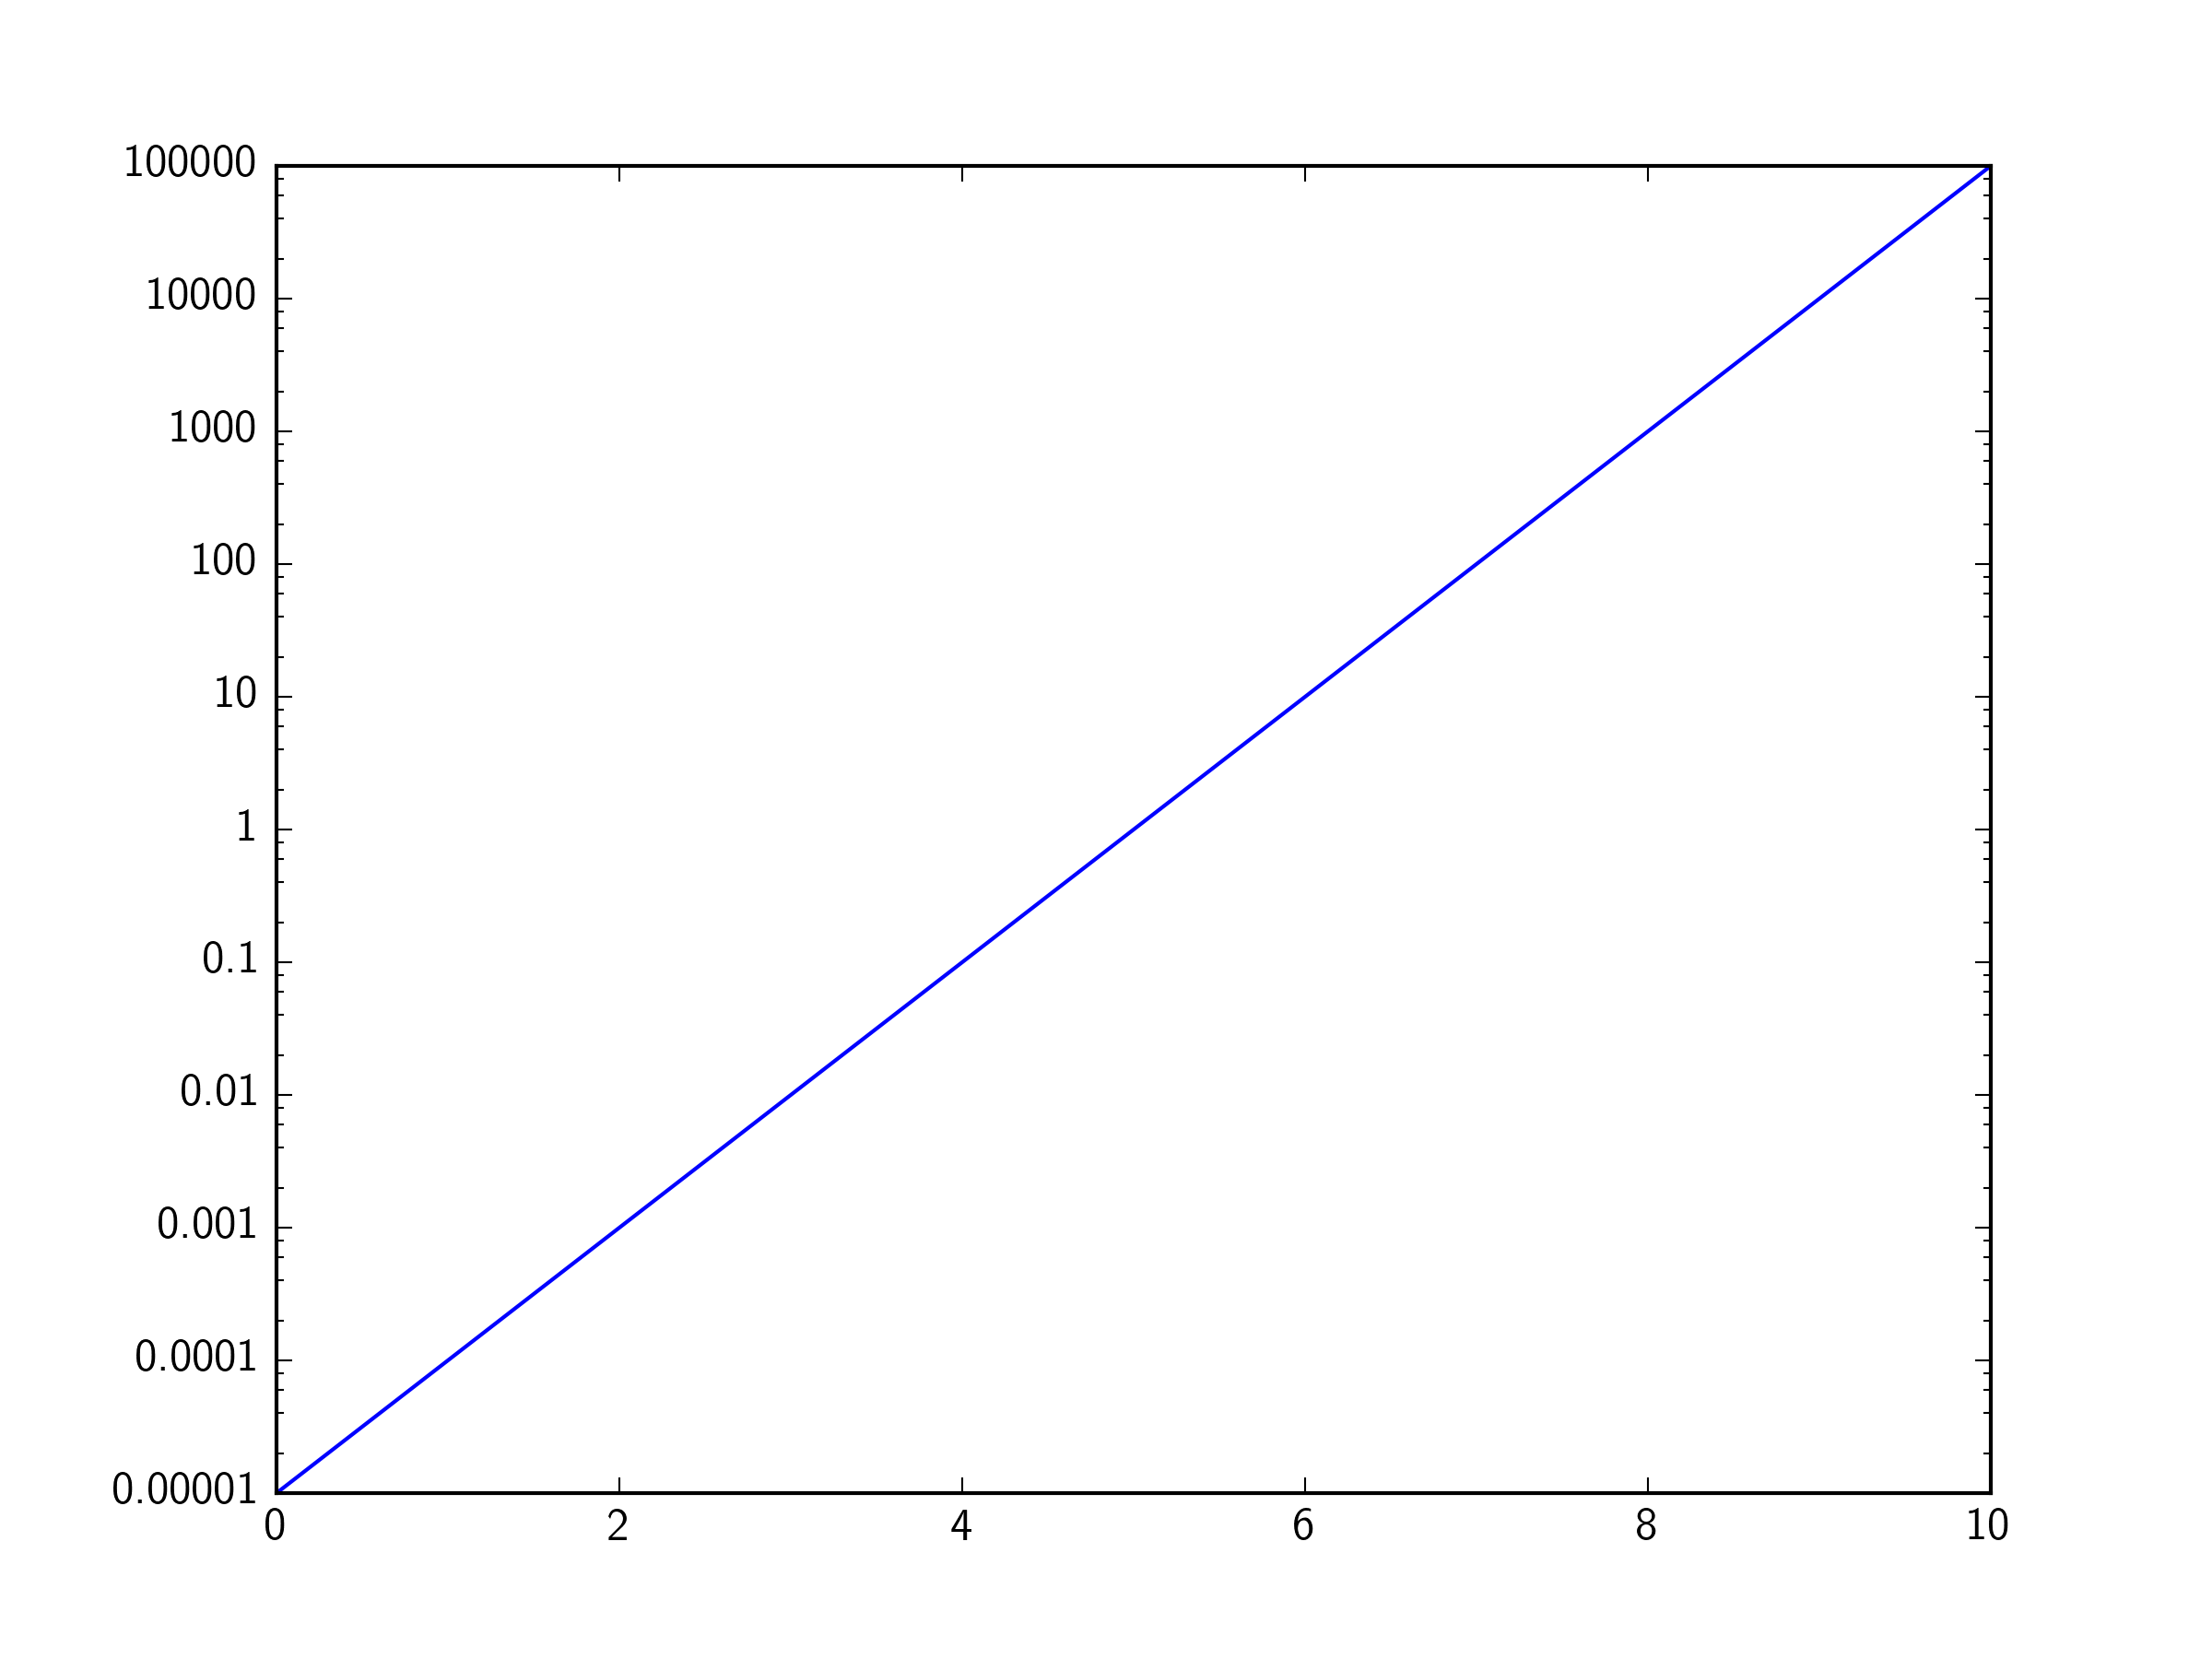
为了清晰起见,这里的lambda函数以更详细的方式写出,但也更容易理解:
def myLogFormat(y,pos):
    # Find the number of decimal places required
    decimalplaces = int(np.maximum(-np.log10(y),0))     # =0 for numbers >=1
    # Insert that number into a format string
    formatstring = '{{:.{:1d}f}}'.format(decimalplaces)
    # Return the formatted tick label
    return formatstring.format(y)

ax.yaxis.set_major_formatter(ticker.FuncFormatter(myLogFormat))Stack Overflow用户
发布于 2017-03-12 15:37:15
关于这些问题
如果我想把数字改成,1,5,10,20呢? -7月10日下午1:26 我想在中间加上滴答,比如50,200等等.我怎么能做到呢?我试过了,set_xticks50.0,200.0,但这似乎行不通!- ThePredator 8月3日12:54 但是对于ax.axis(1,100,1,100),ScalarFormatter给出了1.0,10.0,.这不是我想要的。我要它给出整数..。-12月7日至15日20时22分
您可以使用小型格式化程序来解决这些问题:
ax.yaxis.set_minor_formatter(matplotlib.ticker.ScalarFormatter())
ax.yaxis.set_minor_formatter(matplotlib.ticker.FormatStrFormatter("%.8f"))
ax.set_yticks([0.00000025, 0.00000015, 0.00000035])
在我的应用程序中,我使用了这种格式方案,我认为它解决了大多数与日志标量格式化相关的问题;对于数据> 1.0或x轴格式化,也可以这样做:
plt.ylabel('LOGARITHMIC PRICE SCALE')
plt.yscale('log')
ax.yaxis.set_major_formatter(matplotlib.ticker.ScalarFormatter())
ax.yaxis.set_major_formatter(matplotlib.ticker.FormatStrFormatter("%.8f"))
ax.yaxis.set_minor_formatter(matplotlib.ticker.ScalarFormatter())
ax.yaxis.set_minor_formatter(matplotlib.ticker.FormatStrFormatter("%.8f"))
#####################################################
#force 'autoscale'
#####################################################
yd = [] #matrix of y values from all lines on plot
for n in range(len(plt.gca().get_lines())):
        line = plt.gca().get_lines()[n]
        yd.append((line.get_ydata()).tolist())
yd = [item for sublist in yd for item in sublist]
ymin, ymax = np.min(yd), np.max(yd)
ax.set_ylim([0.9*ymin, 1.1*ymax])
#####################################################
z = []
for i in [0.0000001, 0.00000015, 0.00000025, 0.00000035,
          0.000001, 0.0000015, 0.0000025, 0.0000035,
          0.00001,  0.000015, 0.000025, 0.000035,
          0.0001, 0.00015, 0.00025, 0.00035,
          0.001, 0.0015, 0.0025, 0.0035,
          0.01, 0.015, 0.025, 0.035,
          0.1, 0.15, 0.25, 0.35]:

    if ymin<i<ymax:
        z.append(i)
ax.set_yticks(z) 有关“强制自动标度”的评论,请参阅:Python matplotlib logarithmic autoscale
产生的结果:

然后创建一个通用机器:
# user controls
#####################################################
sub_ticks = [10,11,12,14,16,18,22,25,35,45] # fill these midpoints
sub_range = [-8,8] # from 100000000 to 0.000000001
format = "%.8f" # standard float string formatting

# set scalar and string format floats
#####################################################
ax.yaxis.set_major_formatter(matplotlib.ticker.ScalarFormatter())
ax.yaxis.set_major_formatter(matplotlib.ticker.FormatStrFormatter(format))
ax.yaxis.set_minor_formatter(matplotlib.ticker.ScalarFormatter())
ax.yaxis.set_minor_formatter(matplotlib.ticker.FormatStrFormatter(format))

#force 'autoscale'
#####################################################
yd = [] #matrix of y values from all lines on plot
for n in range(len(plt.gca().get_lines())):
        line = plt.gca().get_lines()[n]
        yd.append((line.get_ydata()).tolist())
yd = [item for sublist in yd for item in sublist]
ymin, ymax = np.min(yd), np.max(yd)
ax.set_ylim([0.9*ymin, 1.1*ymax])

# add sub minor ticks
#####################################################
set_sub_formatter=[]
for i in sub_ticks:
    for j in range(sub_range[0],sub_range[1]):
        set_sub_formatter.append(i*10**j)
k = []
for l in set_sub_formatter:
    if ymin<l<ymax:
        k.append(l)
ax.set_yticks(k)
#####################################################
产量:

https://stackoverflow.com/questions/21920233
复制相似问题
腾讯云开发者

Copyright © 2013 - 2026 Tencent Cloud. All Rights Reserved. 腾讯云 版权所有
深圳市腾讯计算机系统有限公司 ICP备案/许可证号:粤B2-20090059  粤公网安备44030502008569号
腾讯云计算(北京)有限责任公司 京ICP证150476号 | 京ICP备11018762号