
matplotlib pick_event可以返回数组识别符而不是值或像素吗?
我试图在matplotlib中为一个图编写一个点选择器。我想让它告诉我我点击过的星图数组的i,j识别码。似乎唯一的选项是event.mouseevent.xdata,它是以所绘制的坐标值表示的,或者Ev.mouseEv.x,它是以像素的形式(从我所能看到的内容来看,“像素”与网格框并不相同,也就是我要寻找的东西)。
我有没有误解xdata/x是什么?有没有办法做我想做的事。
谢谢尼尔
编辑:正在单击的图像是一个2D数组图,例如pcolormesh。
回答 2
Stack Overflow用户
发布于 2014-02-18 11:11:31
你可以:
- 首先,让您的艺术家(下面的例子中的数组)可选。
- 在单击操作时,检查单击的对象是否是艺术家。
- 使用
event.ind[0]属性获取索引。
进一步的文档这里。例子如下:
from numpy import linspace
from numpy import cos
from numpy import pi
import matplotlib.pyplot as plt
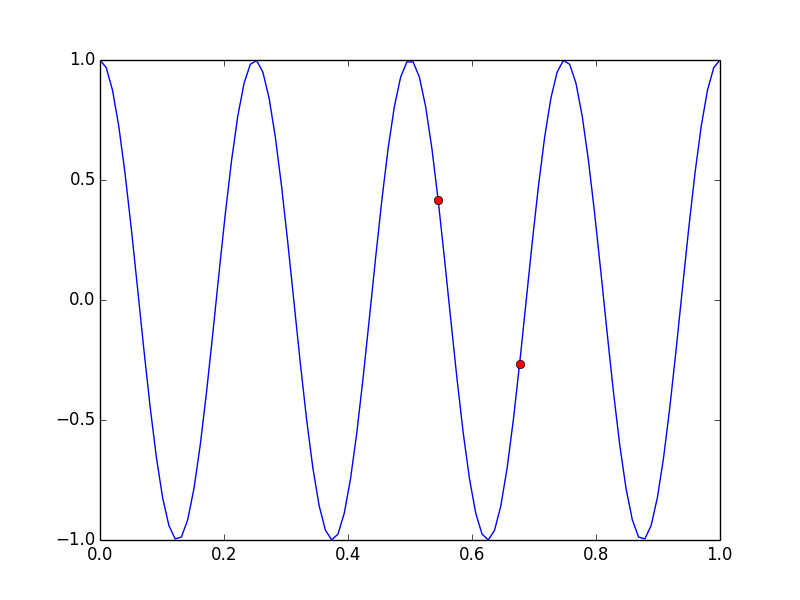
x = linspace(0,1,100)
y = cos(x*8*pi) # your array
fig = plt.figure()
ax = fig.add_subplot(111)
line, = ax.plot(x, y, 'b',picker=10)
def onpick(event):
if event.artist!=line: #check that you clicked on the object you wanted
return True
if not len(event.ind): #check the index is valid
return True
ind = event.ind[0]
ax.plot(x[ind],y[ind],'ro')
fig.canvas.draw()
return True
fig.canvas.mpl_connect('pick_event', onpick)
fig.show()
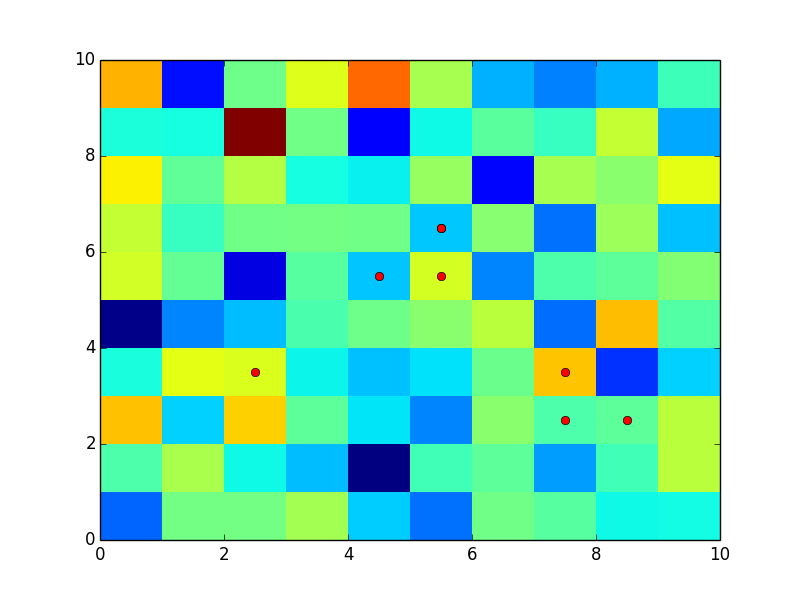
编辑:好的。然后,您可以首先精确地在网格点绘制一条线,然后在上面绘制pcolormesh对象,并隐藏这条线。这是密码
x = linspace(0,9,10)+.5
y = linspace(0,9,10)+.5   # your array
x,y=meshgrid(x,y)
x=x.flatten()
y=y.flatten()

fig = plt.figure()
ax = fig.add_subplot(111)

line, = ax.plot(x, y, 'b',picker=10)
line.set_visible(False)
ax.pcolormesh(np.random.randn(10,10))

def onpick(event):

    if event.artist!=line:  #check that you clicked on the object you wanted
        return True
    if not len(event.ind):  #check the index is valid
        return True
    ind = event.ind[0]

    ax.plot(x[ind],y[ind],'ro')

    fig.canvas.draw()
    return True

fig.canvas.mpl_connect('pick_event', onpick)
fig.show()
Stack Overflow用户
发布于 2017-05-12 21:26:18
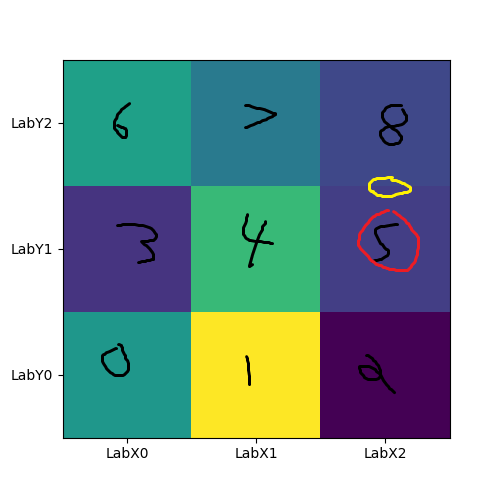
我有一个类似的问题,并使它开始工作。不过,首先,如果您发布一些示例代码,这是很有帮助的。以下是我从一个用于更新嵌入式图表的不同示例中重新编排的内容,但无论如何,我还是必须添加一个选择器。我现在遇到的问题是,对于pcolormesh来说,选择器只在单击边界时才返回(gg349技术解决了这个问题.但难以实施海事组织)。如果您运行下面的代码并单击绘图按钮并单击单元格的边框,您可以看到我是如何返回“数据”点的(在本例中,仅是标签索引,但您得到的是jist:
In [1]
import matplotlib
matplotlib.use('TkAgg')
from matplotlib.backends.backend_tkagg import FigureCanvasTkAgg, NavigationToolbar2TkAgg
from matplotlib.figure import Figure
#import matplotlib.animation as animation
#from matplotlib import style
import numpy as np

import Tkinter as tk
import ttk

def customplot(f,X):
    try:
        f.clf()
    except:
        None
    try:
        ax=ax
    except:
        ax=f.add_subplot(111)
    ax.pcolormesh(X,picker=True)
    ax.set_yticks(arange(0.5,len(X)+0.5))
    ax.set_xticks(arange(0.5,len(X)+0.5))
    ax.set_yticklabels(["LabY"+str(l) for l in range(len(X))])
    ax.set_xticklabels(["LabX"+str(l) for l in range(len(X))])

class My_GUI:

    def __init__(self,master):
        self.master=master
        self.f = Figure(figsize=(5,5), dpi=100)
        self.canvas1=FigureCanvasTkAgg(self.f,self.master)
        self.updatechartbutton=tk.Button(master=master,text='update plot',command=self.drawcustomplot)
        self.canvas1.get_tk_widget().pack(side="top",fill='x',expand=True)
        self.canvas1.mpl_connect('pick_event',self.onpick)
        self.toolbar=NavigationToolbar2TkAgg(self.canvas1,master)
        self.toolbar.update()
        self.toolbar.pack(side='top',fill='x')
        self.updatechartbutton.pack(side='top')

    def drawcustomplot(self):
        self.X=array(np.random.normal(size=[3,3]))
        customplot(self.f,self.X)
        #plt.xticks([1,2,3],['one','two','three'])
        self.canvas1.show()

    def onpick(self,event):
        print('Returned indices')
        print(event.ind)
        print('mapping back:')
        self.myxlabels=["LabX"+str(l) for l in range(len(self.X))]
        self.myylabels=["LabY"+str(l) for l in range(len(self.X))]
        self.ypos=event.ind[0] / 3
        self.xpos=event.ind[0] % 3
        print("Y: "+str(self.myylabels[self.ypos])+'  X:'+str(self.myxlabels[self.xpos]))


root=tk.Tk()
gui=My_GUI(root)
root.mainloop()
当您单击时,可以看到它返回索引,然后是我重新映射的点:
Out [1]
Returned indices
[2]
mapping back:
Y: LabY0  X:LabX2
Returned indices
[1]
mapping back:
Y: LabY0  X:LabX1
Returned indices
[7]
mapping back:
Y: LabY2  X:LabX1
Returned indices
[8]
mapping back:
Y: LabY2  X:LabX2
Returned indices
[5 8]
mapping back:
Y: LabY1  X:LabX2
例如,在上一次单击时,我单击了右中和右上角之间的边框,返回索引5 8(第5框和第8框从左下角到右上角先沿行计数。在这里,我总是说,接受第一个索引(因此,如果您单击您想要的框的顶部,它将返回正确的索引)。因此,在这里,我们正确地返回行Y1和列X2。
我知道这可能不太理想,我还在想方设法让它成为触发事件的盒子的中心,但至少向你展示了如何从pcolormesh拾取器返回的索引中获取一些数据。
如果我的例子不清楚,这里是我最后一次点击的可视化。数字是从每个框中从event.ind返回的索引,5左右的红色圆圈表示这是我的代码为其查找标签的索引,当我单击黄色圆圈的位置时返回。
https://stackoverflow.com/questions/21851114
复制相似问题
腾讯云开发者

Copyright © 2013 - 2026 Tencent Cloud. All Rights Reserved. 腾讯云 版权所有
深圳市腾讯计算机系统有限公司 ICP备案/许可证号:粤B2-20090059 ![]() 粤公网安备44030502008569号
粤公网安备44030502008569号
腾讯云计算(北京)有限责任公司 京ICP证150476号 | 京ICP备11018762号