
构建一棵圆形系统发育树
我有一个与它们相关的基因和疾病表,我想构建一个系统发育树,并将它们的diseases.Below基因分组为一个样本数据集,其中gene1列属于disease1,gene2属于疾病。
gene1   gene2   disease1           disease2
AGTR1   ACHE    cancer              tumor
AGTR1   ACHE    parkinson's         asthma
ALOX5   ADRB1   myocardial infarct  heart failure
AR ADORA1 breast cancer anxiety disorder为了我的目的,我想要一个循环的系统发育树,给出在下面的链接:http://itol.embl.de/itol.cgi
有什么建议在R或任何软件中这样做吗?
谢谢
我正在运行的代码,现在:
d=read.csv("genes_disease.txt",sep="\t",header=TRUE)
phyl_gad <-as.phylo(hclust(dist(d)))
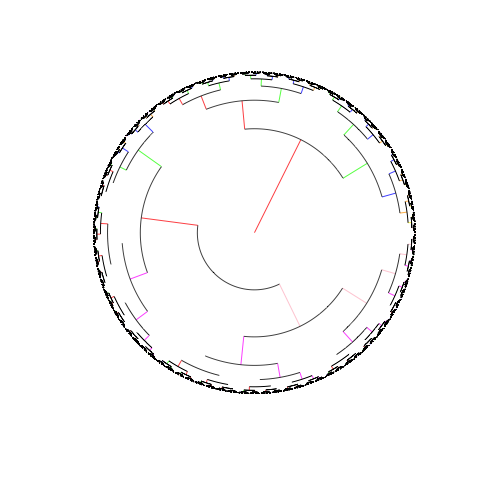
plot(phyl_gad,type="fan",edge.col=c("red","green","blue","orange","yellow","pink","magenta","white"),show.tip.label=FALSE)如果我做了show.tip.label=TRUE,会有太多的标签被绘制出来,使提示变得杂乱无章。
我修改的数据集现在只有两列,一列用于基因,一列用于疾病。
回答 2
Stack Overflow用户
发布于 2014-02-04 23:57:18
啊我以前也这么做过。正如Bryan所说,您想要使用ape包。假设您有一个hclust对象。例如,
library(ape)
fit<-hclust(d,method='ward')
plot(as.phylo(fit),type='fan',label.offset=0.1,no.margin=TRUE)如果要修改树梢的颜色,可以使用cutree和tip.color参数。这将为不同的集群创建一组重复的颜色(例如,color=c('red','blue')将有交替的蓝色和红色文本作为分支的末尾。
nclus=...#insert number of clusters you want to cut to
color=...#insert a vector of colors here
fit<-hclust(d,method='ward')
color_list=rep(color,nclus/length(color))
clus=cutree(fit,nclus)
plot(as.phylo(fit),type='fan',tip.color=color_list[clus],label.offset=0.1,no.margin=TRUE)
我不确定您想使用哪种类型的聚类方法(我使用的是Ward的方法),但这就是您要使用的方法。
Stack Overflow用户
发布于 2017-07-25 02:49:42
我认为你想做的不是系统发育,而是距离上的集群。这里是一个可重复的例子。
library(XML)
library(RCurl)#geturl
library(rlist)
library(plyr)
library(reshape2)
library(ggtree)
#get the genes/ diseases info from internet
#example from http://www.musclegenetable.fr/
urllist<-paste0("http://195.83.227.65/4DACTION/GS/",LETTERS[1:24] )
theurl <- lapply(urllist, function(x) RCurl::getURL(x,.opts = list(ssl.verifypeer = T) ) )# wait
theurl2<-lapply(theurl, function(x) gsub("<span class='Style18'>","__",x))
tables <- lapply(theurl2, function (x) XML::readHTMLTable(x) )
tables2 <- lapply(tables, function(x) rlist::list.clean(x, fun = is.null, recursive = FALSE) )
unlist1 = lapply(tables2, plyr::ldply)
newdf<-do.call(rbind, unlist1)
colnames(newdf)[4]<-"diseases"
colnames(newdf)[2]<-"Gene"
newdf$gene<-sub("([A-z0-9]+)(__)(.*)","\\1",newdf$Gene)
newdf$diseases<-sub("(\\* )","",newdf$diseases, perl=T)
#split info of several diseases per gene, and simplify text
#to allow better clustering
newdf2<-as.data.frame(data.table::setDT(newdf)[, strsplit(as.character(diseases), "* ", fixed=TRUE), by = .(gene, diseases)
][,.(diseases = V1, gene)])
newdf2$disease<-sub("([A-z0-9,\\-\\(\\)\\/ ]+)( \\- )(.*)","\\1",newdf2$diseases)
newdf2$disease<-gsub("[0-9,]","",newdf2$disease)
newdf2$disease<-gsub("( [A-Z]{1,2})$","",newdf2$disease)
newdf2$disease<-gsub("(\\-)","",newdf2$disease)
newdf2$disease<-gsub("\\s*\\([^\\)]+\\)","",newdf2$disease)
newdf2$disease<-gsub("\\s*type.*","",newdf2$disease, ignore.case = T)
newdf2$disease<-gsub("(X{0,3})(IX|IV|V?I{0,3})","", newdf2$disease)
newdf2$disease<-gsub("( [A-z]{1,2})$","",newdf2$disease)
newdf2$disease<-sub("^([a-z])(.*)","\\U\\1\\E\\2",newdf2$disease, perl=T)
newdf2$disease<-trimws(newdf2$disease)
newdf2<-newdf2[,c(2,3)]
#make clustering and tree
newcasted <- reshape2::dcast(newdf2, gene ~ disease)
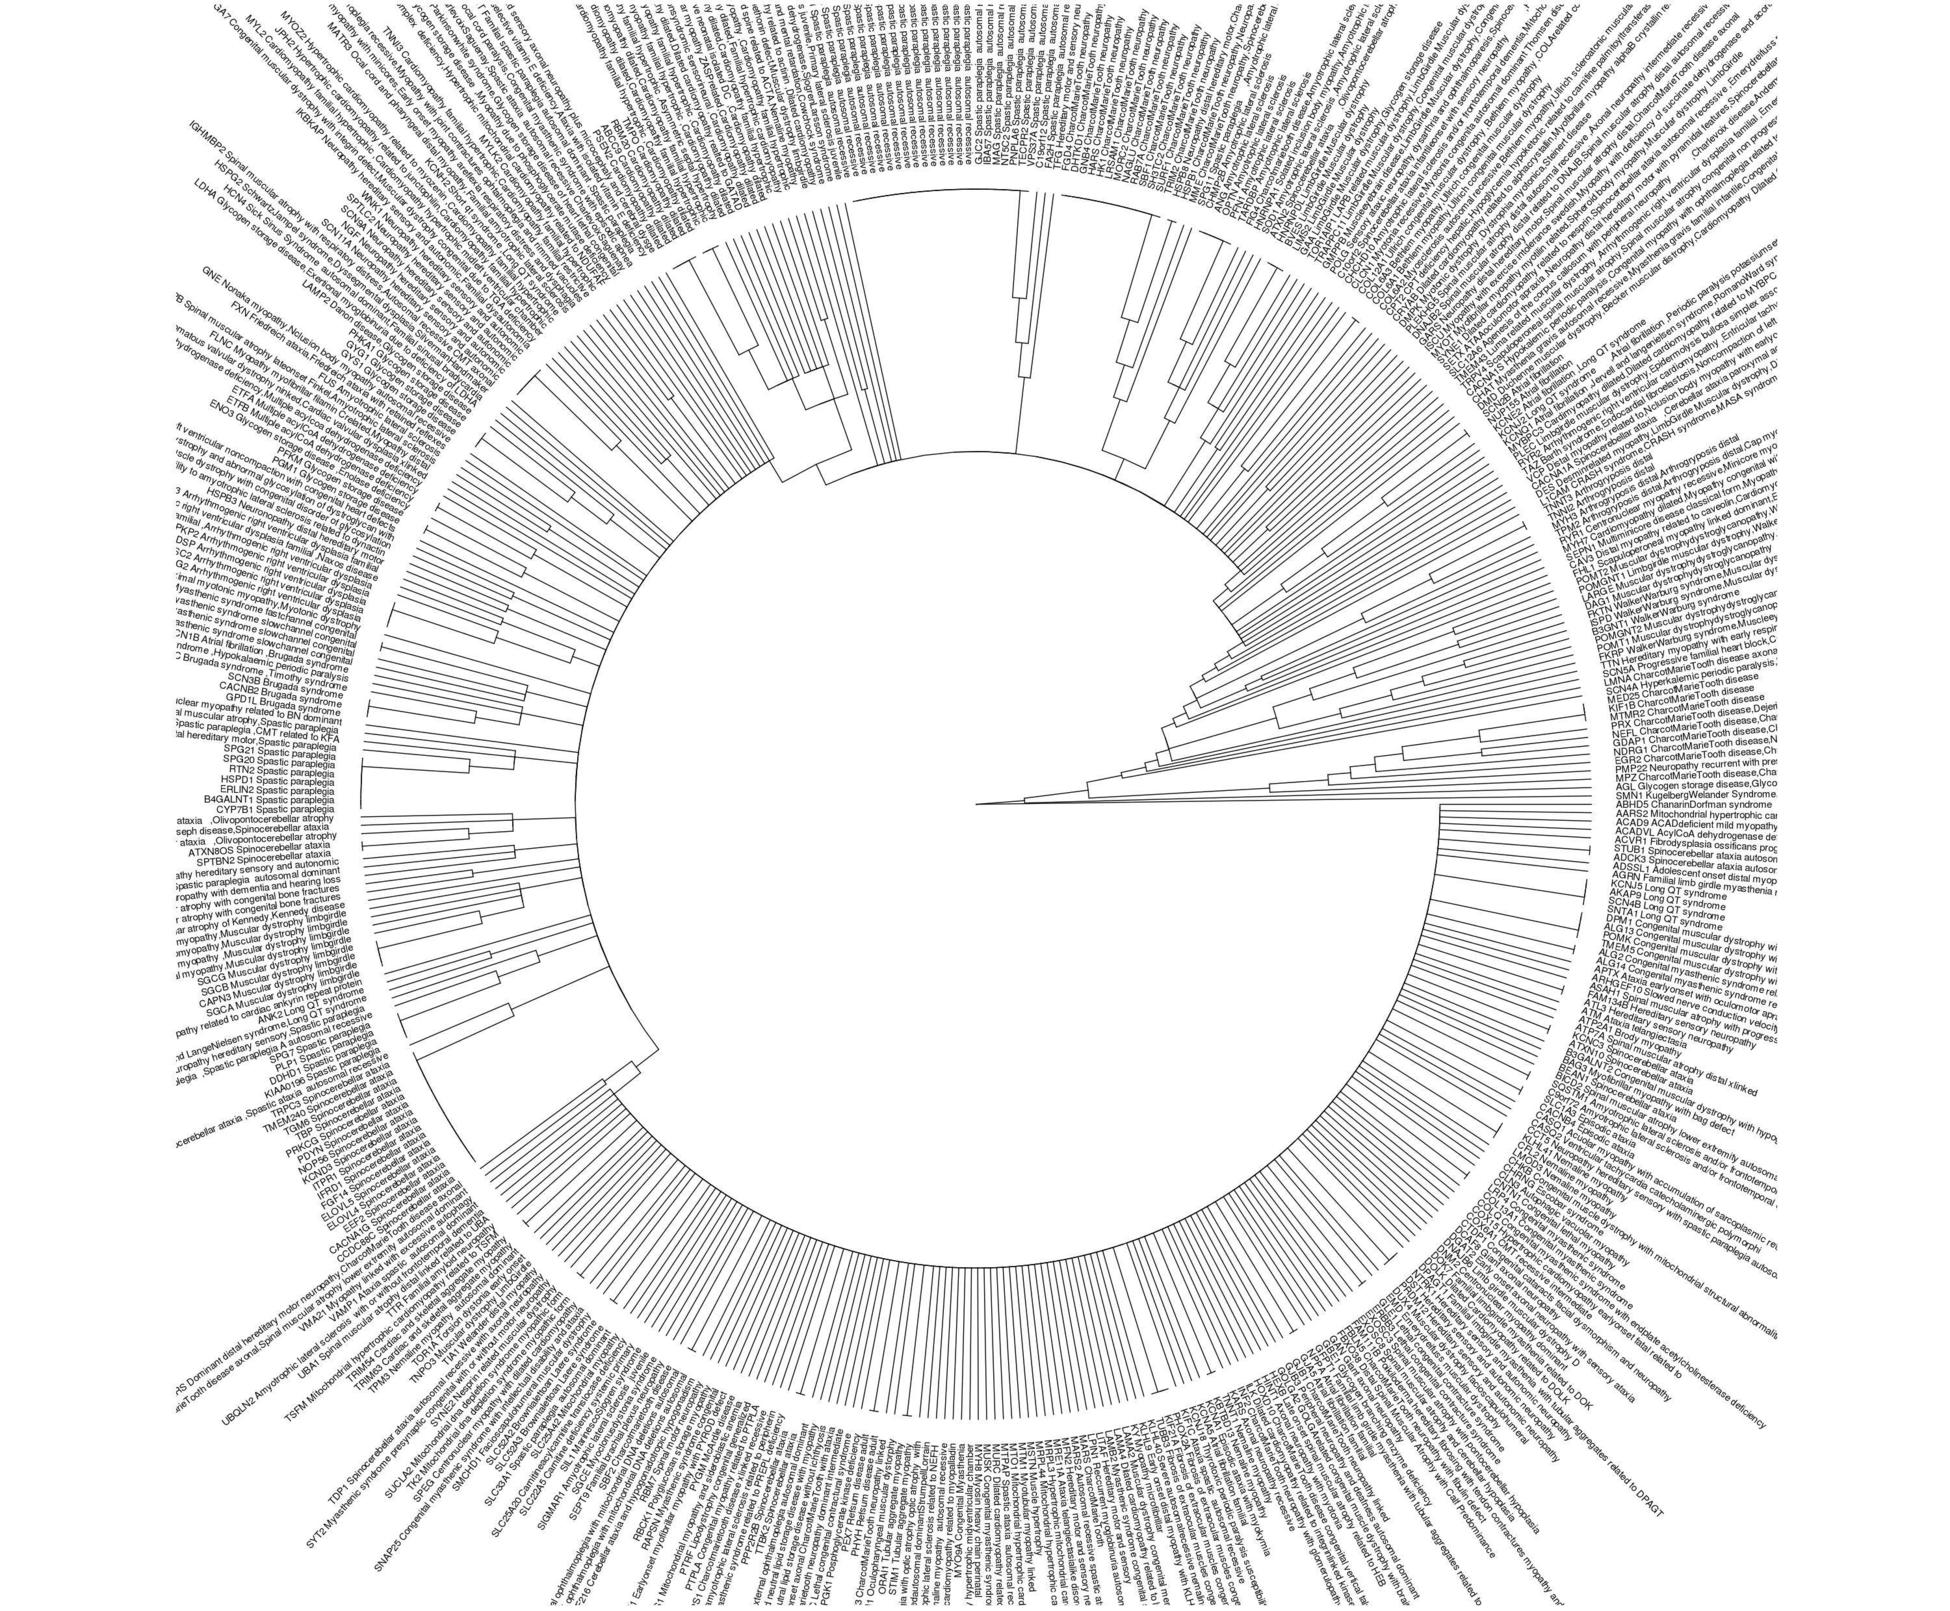
phyl_gad <-ape::as.phylo(hclust(dist(newcasted)))
#use names of genes and diseases in tree
DT <- data.table::as.data.table(newdf2)
newdf4<-as.data.frame(DT[, lapply(.SD, paste, collapse=","), by = gene, .SDcols = 2])
newdf4$genemerge<-paste(newdf4$gene, newdf4$disease)
phyl_gad$tip.label<-newdf4$genemerge
#plot tree
ggtree::ggtree(phyl_gad, layout = "circular")+ ggtree::geom_tiplab2(offset=0.1, align = F, size=4)
https://stackoverflow.com/questions/21565143
复制相似问题
腾讯云开发者

Copyright © 2013 - 2026 Tencent Cloud. All Rights Reserved. 腾讯云 版权所有
深圳市腾讯计算机系统有限公司 ICP备案/许可证号:粤B2-20090059 ![]() 粤公网安备44030502008569号
粤公网安备44030502008569号
腾讯云计算(北京)有限责任公司 京ICP证150476号 | 京ICP备11018762号