
在matplotlib直方图中的联调中有错误吗?或scipy.stats中rvs方法的非随机性
在matplotlib直方图中的联调中有错误吗?或scipy.stats中rvs方法的非随机性
提问于 2014-01-28 14:51:10
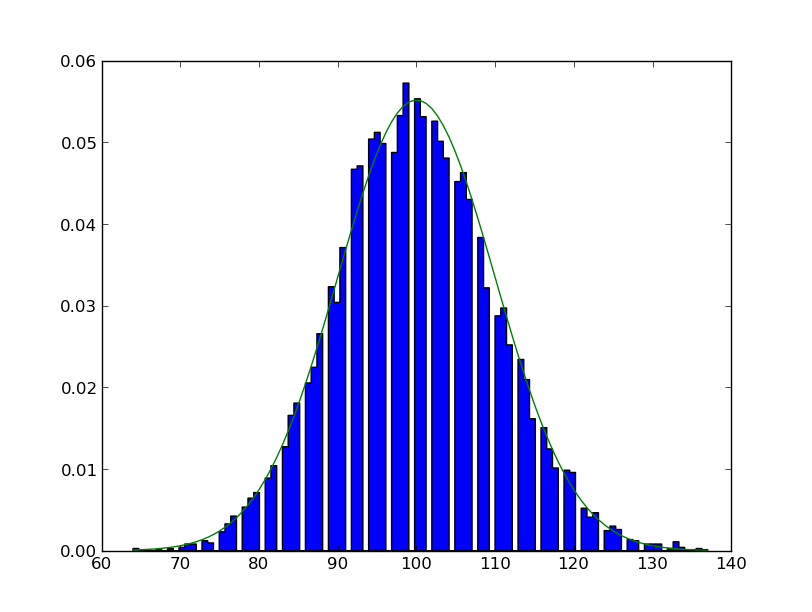
下面的代码始终使用空的回收箱生成直方图,即使样本数量很大。空的垃圾箱似乎有一个规则的间隔,但宽度与其他正常的垃圾箱相同。这显然是错误的-为什么会发生这种事?似乎不是rv方法是非随机的,就是hist binning过程被套用了。另外,试着把垃圾箱的数量改到50个,就会出现另一个奇怪的现象。在这种情况下,看起来每个其他的bin都有一个与其相关的伪造的高计数。
""" An example of how to plot histograms using matplotlib
This example samples from a Poisson distribution, plots the histogram
and overlays the Gaussian with the same mean and standard deviation

"""

from scipy.stats import poisson
from scipy.stats import norm
from matplotlib import pyplot as plt
#import matplotlib.mlab as mlab

EV = 100   # the expected value of the distribution
bins = 100 # number of bins in our histogram
n = 10000
RV = poisson(EV)  # Define a Poisson-distributed random variable

samples = RV.rvs(n)  # create a list of n random variates drawn from that random variable

events, edges, patches = plt.hist(samples, bins, normed = True, histtype = 'stepfilled')  # make a histogram

print events  # When I run this, some bins are empty, even when the number of samples is large

# the pyplot.hist method returns a tuple containing three items. These are events, a list containing
# the counts for each bin, edges, a list containing the values of the lower edge of each bin
# the final element of edges is the value of the high edge of the final bin
# patches, I'm not quite sure about, but we don't need at any rate
# note that we really only need the edges list, but we need to unpack all three elements of the tuple
# for things to work properly, so events and patches here are really just dummy variables

mean = RV.mean()  # If we didn't know these values already, the mean and std methods are convenience
sd = RV.std()     # methods that allow us to retrieve the mean and standard deviation for any random variable

print "Mean is:", mean, " SD is: ", sd

#print edges

Y = norm.pdf(edges, mean, sd)  # this is how to do it with the sciPy version of a normal PDF
# edges is a list, so this will return a list Y with normal pdf values corresponding to each element of edges

binwidth = (len(edges)) / (max(edges) - min(edges))
Y = Y * binwidth
print "Binwidth is:", 1/binwidth
# The above is a fix to "de-normalize" the normal distribution to properly reflect the bin widths

#Q = [edges[i+1] - edges[i] for i in range(len(edges)-1)]
#print Q  # This was to confirm that the bins are equally sized, which seems to be the case.

plt.plot(edges, Y)
plt.show()
回答 1
Stack Overflow用户
回答已采纳
发布于 2014-01-28 15:07:14
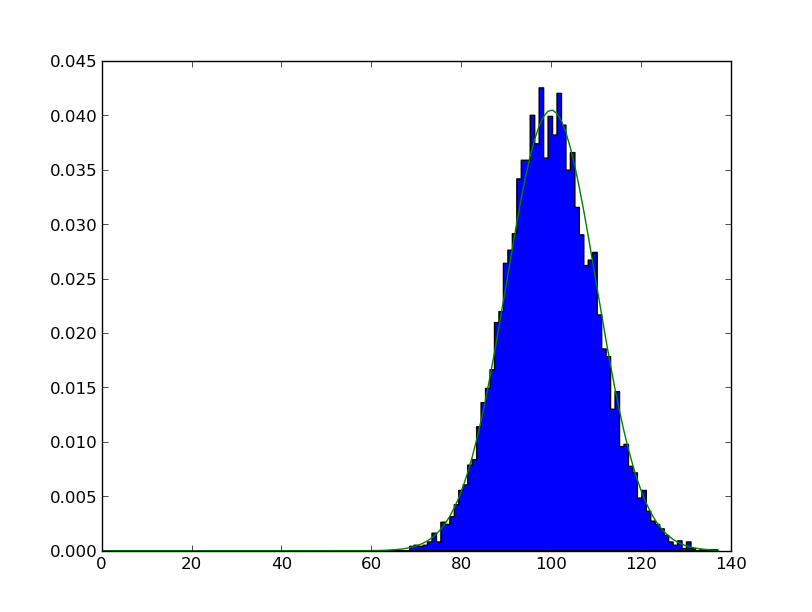
当输入数据只接受整数值(就像泊松RV的情况一样),并且有比这个间隔更多的回收箱时,空回收箱就会被期望。如果是这样的话,就会有永远不会捕获样本的回收箱,还有一些会捕获多个间隔样本的回收箱。更改回收箱的数量和范围,以捕获一个整数间隔和差距消失。
plt.hist(samples,
         range=(0,samples.max()),
         bins=samples.max()+1,
         normed = True, histtype = 'stepfilled')
页面原文内容由Stack Overflow提供。腾讯云小微IT领域专用引擎提供翻译支持
原文链接:
https://stackoverflow.com/questions/21408843
复制相关文章
相似问题
腾讯云开发者

Copyright © 2013 - 2026 Tencent Cloud. All Rights Reserved. 腾讯云 版权所有
深圳市腾讯计算机系统有限公司 ICP备案/许可证号:粤B2-20090059 ![]() 粤公网安备44030502008569号
粤公网安备44030502008569号
腾讯云计算(北京)有限责任公司 京ICP证150476号 | 京ICP备11018762号