
scale_x_discrete不标注N/A值
scale_x_discrete不标注N/A值
提问于 2014-01-04 21:43:36
我使用ggplot2绘制一个直方图,其中包含一些N/A值。当我标出x轴时,我的N/A条将保持无标记(1),但是当我没有标记我的直方图时,我的N/A值的自动标签就会出现(2)。
怎样才能使我的N/A值被贴上这样的标签?
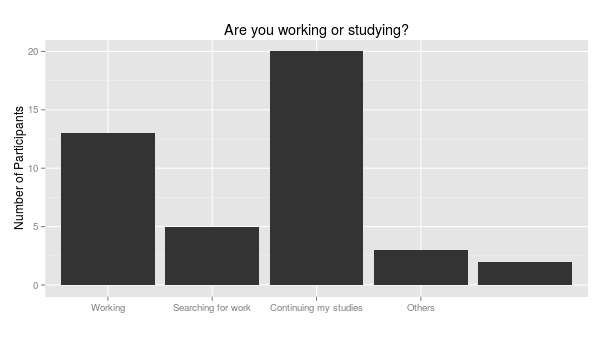
(1)标记直方图-缺乏N/A值的标签!
doforaliving <- factor(rawdata$Q009)
ggplot(rawdata, aes(x=doforaliving)) + geom_histogram(binwidth=.5) + xlab("") + ylab("Number of Participants") + ggtitle("Are you working or studying?") + scale_x_discrete(breaks=c("1", "2", "3", "4", "na.value"), labels=c("Working", "Searching for work", "Continuing my studies", "Other", "NA"))
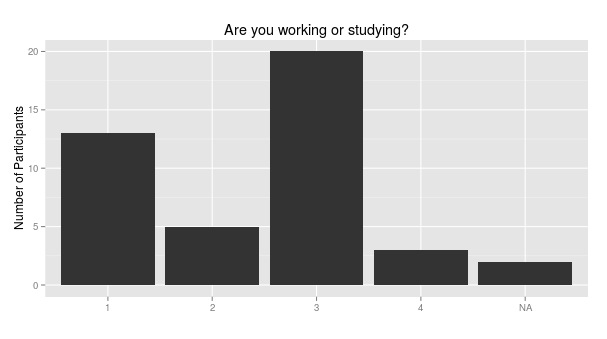
(2)未标记直方图-- N/A值被标记!
doforaliving <- factor(rawdata$Q009)
ggplot(rawdata, aes(x=doforaliving)) + geom_histogram(binwidth=.5) + xlab("") + ylab("Number of Participants") + ggtitle("Are you working or studying?")
回答 1
Stack Overflow用户
回答已采纳
发布于 2014-01-04 23:56:45
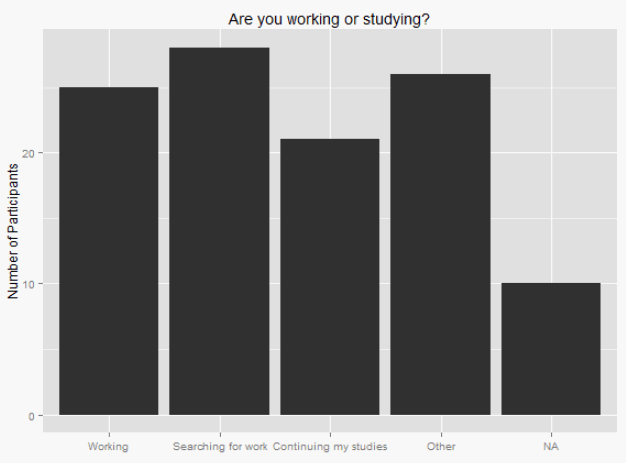
根据您提供的信息,我想说:将na.value替换为NA
set.seed(1)
library(ggplot2)
rawdata <- data.frame(doforaliving=as.factor(c(sample(1:4, 100, replace=T), rep(NA, 10))))
ggplot(rawdata, aes(x=doforaliving)) +
  geom_histogram(binwidth=.5) + xlab("") +
  ylab("Number of Participants") +
  ggtitle("Are you working or studying?") +
  scale_x_discrete(breaks=c("1", "2", "3", "4",NA),
                   labels=c("Working", "Searching for work", "Continuing my studies", "Other", "NA"))
页面原文内容由Stack Overflow提供。腾讯云小微IT领域专用引擎提供翻译支持
原文链接:
https://stackoverflow.com/questions/20927743
复制相关文章
相似问题
腾讯云开发者

Copyright © 2013 - 2026 Tencent Cloud. All Rights Reserved. 腾讯云 版权所有
深圳市腾讯计算机系统有限公司 ICP备案/许可证号:粤B2-20090059 ![]() 粤公网安备44030502008569号
粤公网安备44030502008569号
腾讯云计算(北京)有限责任公司 京ICP证150476号 | 京ICP备11018762号