
向ggplot2中的实验室传递字符串变量不被接受
向ggplot2中的实验室传递字符串变量不被接受
提问于 2013-12-31 16:38:11
seed=1234
df=data.frame(rnorm(50)*100)
names(df)="Temperature"; df
nn = length(df$Temperature)
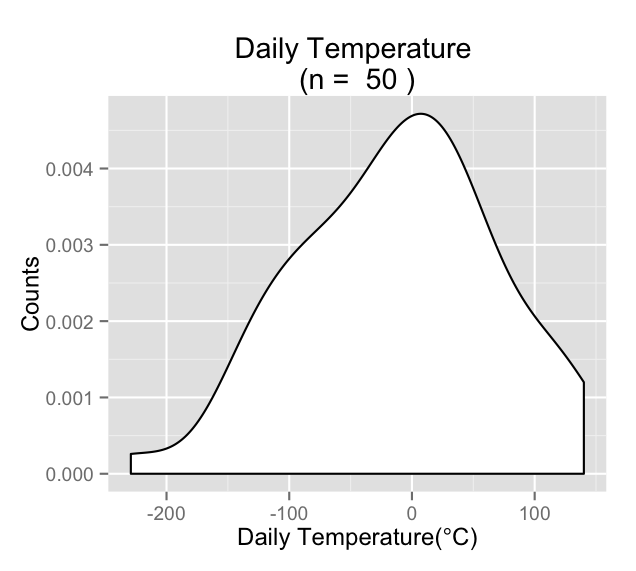
title = "Daily Temperature"
title2 = substitute(paste(title,"(",degree,"C)"))
title3 = paste(title,"\n(n = ",nn,")")
h1 = ggplot(df, aes(x=df[,1]))+ geom_density(colour = "black", fill = "white", binwidth = 5)
+ labs(list(title = title3, x = title2, y = "Counts"))
h1上面的小例子描述了我在x轴上显示"title2“的问题。我搜索并尝试了许多好的建议(例如,aes_string、表达式等)。但还是不能让这件事起作用。如果我将title2替换为;title2 = expression(paste("Daily Temperature (",degree,"C)")),它可以正常工作。提前感谢您的帮助!文斯
回答 1
Stack Overflow用户
回答已采纳
发布于 2013-12-31 17:32:43
require(ggplot2)  # not everyone has this package loaded by default
seed=1234
df=data.frame(rnorm(50)*100)
names(df)="Temperature"; df
nn = length(df$Temperature)
title = "Daily Temperature"要做到这一点,就需要有算计的经验。看到了吗?计谋和?替代。我发现,如果您使用paste和*,那么通常不需要使用图形化的~。
  # first argument to substitute is an expression object
  # you need to supply a list as the second argument to substitute
title2 = substitute(title*"("*degree*C*")", list(title=title) )
title3 = paste(title,"\n(n = ",nn,")")
h1 = ggplot(df, aes(x=df[,1]))+
  geom_density(colour = "black", fill = "white", binwidth = 5) +
  labs(list(title = title3, x = title2, y = "Counts"))
h1
另一种在绘图表达式中使用圆括号的方法是使用plotmath函数(它不同于普通的list函数,因为它创建逗号分隔的表达式)。只有一个表达式,它只给出括号:
title2 = substitute(title*list(degree*C), list(title=title) )页面原文内容由Stack Overflow提供。腾讯云小微IT领域专用引擎提供翻译支持
原文链接:
https://stackoverflow.com/questions/20860434
复制相关文章
相似问题
腾讯云开发者

Copyright © 2013 - 2026 Tencent Cloud. All Rights Reserved. 腾讯云 版权所有
深圳市腾讯计算机系统有限公司 ICP备案/许可证号:粤B2-20090059 ![]() 粤公网安备44030502008569号
粤公网安备44030502008569号
腾讯云计算(北京)有限责任公司 京ICP证150476号 | 京ICP备11018762号