
我无法绘制以下数据:(查准率-回忆曲线)
我无法绘制以下数据:(查准率-回忆曲线)
提问于 2013-12-20 14:36:37
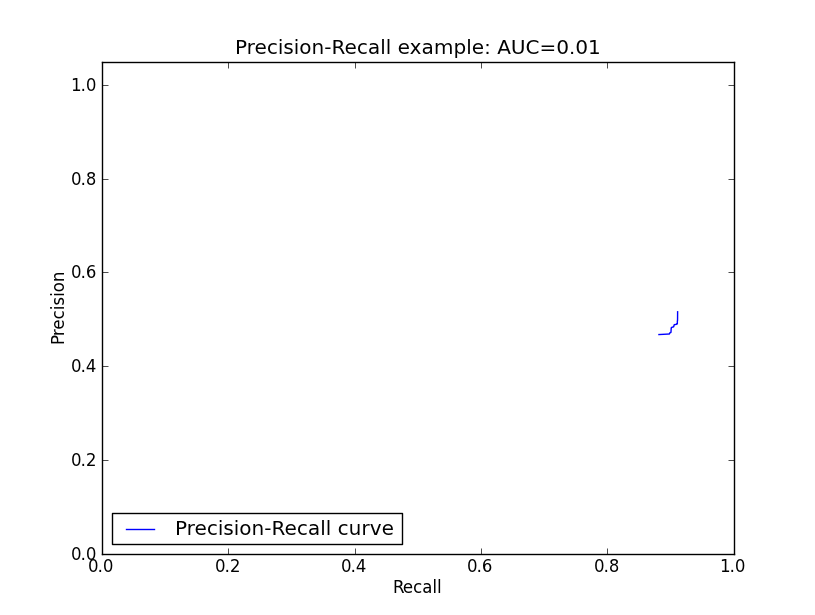
嗨,我试图用下列数据绘制召回-精确曲线:
      Recall    Precision
0.88196 0.467257
0.898501    0.468447
0.89899 0.470659
0.900789    0.471653
0.900922    0.472038
0.901012    0.472359
0.901345    0.480144
0.901695    0.482353
0.902825    0.482717
0.903261    0.483125
0.905152    0.483621
0.905575    0.485088
0.905682    0.486339
0.906109    0.488117
0.906466    0.488459
0.90724 0.488587
0.908989    0.488875
0.909941    0.489362
0.910125    0.489493
0.910314    0.490196
0.910989    0.49022
0.91106 0.490786
0.911137    0.496624
0.91129 0.496891
0.911392    0.497301
0.911392    0.499379
0.911422    0.5
0.911452    0.503783
0.911525    0.515829
源代码:
import random
import pylab as pl
from sklearn import svm, datasets
from sklearn.metrics import precision_recall_curve
from sklearn.metrics import auc

##Load Recall
fname = "recall.txt"
fname1 = "precision.txt"

recall = []
precision = []

with open(fname) as inf:
    for line in inf:
        recall.append(float(line))

with open(fname1) as inf:
    for line in inf:
        precision.append(float(line))

area = auc(recall, precision)
print("Area Under Curve: %0.2f" % area)

pl.clf()
pl.plot(recall, precision, label='Precision-Recall curve')
pl.xlabel('Recall')
pl.ylabel('Precision')
pl.ylim([0.0, 1.05])
pl.xlim([0.0, 1.0])
pl.title('Precision-Recall example: AUC=%0.2f' % area)
pl.legend(loc="lower left")
pl.show()
AUC = 0.01的面积是正常的吗?
回答 1
Stack Overflow用户
回答已采纳
发布于 2013-12-20 15:28:53
这似乎是正确的答案。
使用numpy.trapz(precission, recall)我得到了AUC = 0.014036223712000031
页面原文内容由Stack Overflow提供。腾讯云小微IT领域专用引擎提供翻译支持
原文链接:
https://stackoverflow.com/questions/20705968
复制相关文章
相似问题
腾讯云开发者

Copyright © 2013 - 2026 Tencent Cloud. All Rights Reserved. 腾讯云 版权所有
深圳市腾讯计算机系统有限公司 ICP备案/许可证号:粤B2-20090059 ![]() 粤公网安备44030502008569号
粤公网安备44030502008569号
腾讯云计算(北京)有限责任公司 京ICP证150476号 | 京ICP备11018762号