
ggmap无法绘制特定区域。
ggmap无法绘制特定区域。
提问于 2013-11-22 11:30:42
我正试图用ggmap来绘制北极的一个特定区域。这个地区的中心在拉特附近的某个地方。80岁。0,不幸的是,只显示了灰色背景和纬度和经轴。我试图绘制不同的区域,我的代码似乎适用于每个位置,除了lat以外的区域。73.6.下面是我的代码示例:
library(ggmap)
library(mapproj)
location <- get_map(location = c(lon = 0, lat = 80), zoom = 4, maptype = "hybrid")
ggmap(location)那么,有谁知道,为什么ggmap无法绘制这个位置呢?
回答 1
Stack Overflow用户
回答已采纳
发布于 2013-11-23 00:02:59
我也遇到了同样的问题(当我试图绘制南极洲地图时),为了绕过它,我求助于ggplot,但是依赖于来自ggmap包的几个函数。正如@Henrik的链接所暗示的,地图投影似乎是问题所在。
整个想法和代码都是由大卫·卡勒提供的。
为了让它对你的案子起作用,你可以这样做:
location <- get_map(location = c(lon = 0, lat = 80), zoom = 4, maptype = "hybrid")
#Create a small data frame to pass to ggplot
fourCorners <- expand.grid(
lon = as.numeric(attr(location, "bb")[, c("ll.lon", "ur.lon")]),
lat = as.numeric(attr(location, "bb")[, c("ll.lat", "ur.lat")])
)
# The inset_raster function needs 4 data coordinates. Pull it out of your "location" that you got via get_map
xmin <- attr(location, "bb")$ll.lon
xmax <- attr(location, "bb")$ur.lon
ymin <- attr(location, "bb")$ll.lat
ymax <- attr(location, "bb")$ur.lat
# Now you are ready to plot it
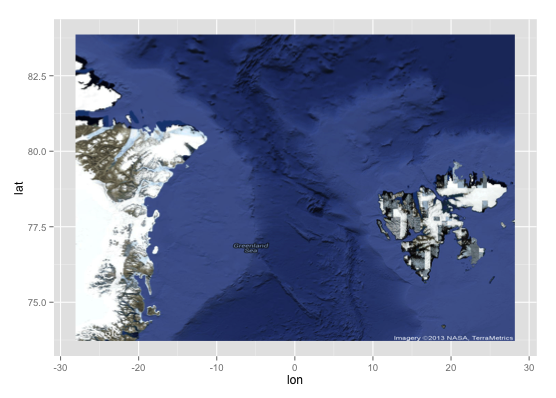
mp <- ggplot(fourCorners, aes(x = lon, y = lat) ) +
inset_raster(location, xmin, xmax, ymin, ymax)
mp这给了你的“混合”地图,居中于(Longitude=0,lat=80)
页面原文内容由Stack Overflow提供。腾讯云小微IT领域专用引擎提供翻译支持
原文链接:
https://stackoverflow.com/questions/20143851
复制相关文章
相似问题
腾讯云开发者

Copyright © 2013 - 2026 Tencent Cloud. All Rights Reserved. 腾讯云 版权所有
深圳市腾讯计算机系统有限公司 ICP备案/许可证号:粤B2-20090059 ![]() 粤公网安备44030502008569号
粤公网安备44030502008569号
腾讯云计算(北京)有限责任公司 京ICP证150476号 | 京ICP备11018762号