
在节点框选项中向图的边缘添加标签
在节点框选项中向图的边缘添加标签
提问于 2013-11-22 05:41:43
我试图在图形中的每一条边缘添加一个标签,如下所示:
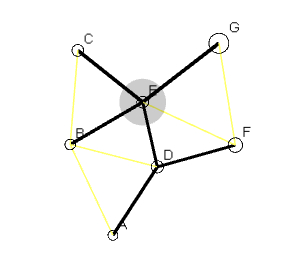
基本上,上面的每一个边缘都有标签在中心:
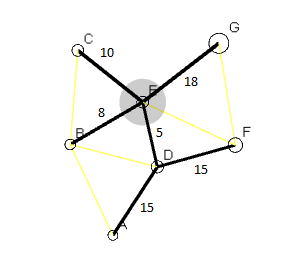
当我向每个图添加一个边时,我尝试添加一个标签,如下所示(对于图g):
g.add_edge(... label=edge.distance ...)经过一些研究,我发现在Nodebox 1,只适用于Mac。下这样的标记是可能的,从文档中看,似乎没有合适的替代Nodebox-OpenGL的方法。我收到的错误:
Traceback (most recent call last):
  File "C:\foo\bar\baz\Imager.py", line 29, in <module>
    g.add_edge(edge.fr, edge.to, length=edge.distance, weight=2, stroke=color(1.0, 0.2, 0.0), label="cheese")
  File "C:\Python27\lib\site-packages\nodebox\graphics\physics.py", line 1254, in add_edge
    e2 = e2(n1, n2, *args, **kwargs)
TypeError: __init__() got an unexpected keyword argument 'label'
你可以重现这个问题:
from nodebox.graphics import *
from nodebox.graphics.physics import Node, Edge, Graph

# Create a graph with randomly connected nodes.
# Nodes and edges can be styled with fill, stroke, strokewidth parameters.
# Each node displays its id as a text label, stored as a Text object in Node.text.
# To hide the node label, set the text parameter to None.
g = Graph()
# Random nodes.
for i in range(50):
    g.add_node(id=str(i+1),
        radius = 5,
        stroke = color(0),
          text = color(0))
# Random edges.
for i in range(75):
    node1 = choice(g.nodes)
    node2 = choice(g.nodes)
    g.add_edge(node1, node2,
        length = 1.0,
        weight = random(),
        stroke = color(0),
        label = "Placeholder")    #!!!!!!!!!!!!! ADDING THE label HERE

# Two handy tricks to prettify the layout:
# 1) Nodes with a higher weight (i.e. incoming traffic) appear bigger.
for node in g.nodes:
    node.radius = node.radius + node.radius*node.weight
# 2) Nodes with only one connection ("leaf" nodes) have a shorter connection.
for node in g.nodes:
    if len(node.edges) == 1:
        node.edges[0].length *= 0.1

g.prune(depth=0)          # Remove orphaned nodes with no connections.
g.distance         = 10   # Overall spacing between nodes.
g.layout.force     = 0.01 # Strength of the attractive & repulsive force.
g.layout.repulsion = 15   # Repulsion radius.

dragged = None
def draw(canvas):

    canvas.clear()
    background(1)
    translate(250, 250)

    # With directed=True, edges have an arrowhead indicating the direction of the connection.
    # With weighted=True, Node.centrality is indicated by a shadow under high-traffic nodes.
    # With weighted=0.0-1.0, indicates nodes whose centrality > the given threshold.
    # This requires some extra calculations.
    g.draw(weighted=0.5, directed=True)
    g.update(iterations=10)

    # Make it interactive!
    # When the mouse is pressed, remember on which node.
    # Drag this node around when the mouse is moved.
    dx = canvas.mouse.x - 250 # Undo translate().
    dy = canvas.mouse.y - 250
    global dragged
    if canvas.mouse.pressed and not dragged:
        dragged = g.node_at(dx, dy)
    if not canvas.mouse.pressed:
        dragged = None
    if dragged:
        dragged.x = dx
        dragged.y = dy

canvas.size = 500, 500
canvas.run(draw)
因此,问题仍然存在,如何在Nodebox-OpenGL中向图形的边缘添加一个标签?
回答 1
Stack Overflow用户
发布于 2013-11-22 07:42:19
正如您在来源中所看到的,add_edge没有参数label。(搜索class Edge(object):)
我能看到的最好的方法是创建您自己的MyEdge类,它是从正式的Edge类中派生出来的,该类使用
txt = Text(str, x=0, y=0, width=None, height=None)或
textpath(string, x=0, y=0, fontname=None, fontsize=None, fontweight=None)()方法中。
编辑注意add_edge方法docstring:
def add_edge(self, id1, id2, *args, **kwargs):
    """ Appends a new Edge to the graph.
        An optional base parameter can be used to pass a subclass of Edge:
        Graph.add_edge("cold", "winter", base=IsPropertyOf)
"""页面原文内容由Stack Overflow提供。腾讯云小微IT领域专用引擎提供翻译支持
原文链接:
https://stackoverflow.com/questions/20137810
复制相关文章
相似问题
腾讯云开发者

Copyright © 2013 - 2026 Tencent Cloud. All Rights Reserved. 腾讯云 版权所有
深圳市腾讯计算机系统有限公司 ICP备案/许可证号:粤B2-20090059 ![]() 粤公网安备44030502008569号
粤公网安备44030502008569号
腾讯云计算(北京)有限责任公司 京ICP证150476号 | 京ICP备11018762号