
用mplot3d绘制matplotlib mplot3d图中的奇数线工艺品
用mplot3d绘制matplotlib mplot3d图中的奇数线工艺品
提问于 2013-10-21 10:27:29
我使用的是mplot3d示例,它使用PolyCollection来堆叠XY-绘图,demo.html。
然而,我在情节中看到了一些奇怪的线条工艺品。
- 我怎样才能移除那些从可见区域消失的水平线?
- 是否有更好的方法沿深度方向堆叠XY图?
下面的脚本生成这个情节,
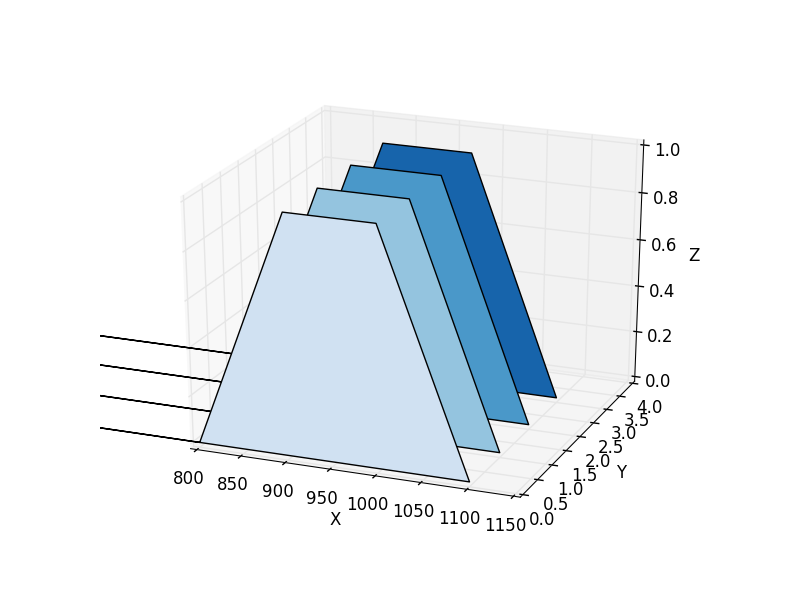
from mpl_toolkits.mplot3d import Axes3D
from matplotlib.collections import PolyCollection
from matplotlib.colors import colorConverter
import matplotlib.pyplot as plt
import numpy as np

zs = []
fig = plt.figure()
ax = fig.gca(projection='3d')
verts = []

# XY data (i.e. "normal line plots")
count = 4
for i in range(count):
    xs, ys = [800.0, 900.0, 1000.0, 1100.],  [0., 1., 1., 0.]
    verts.append(list(zip(xs, ys)))

# Z position (i.e. depth at which the XY plot is drawn)
zs = [0,1,2,3]

colours = plt.cm.Blues(np.linspace(0.2, 0.8, len(zs)))
poly = PolyCollection(verts, facecolors = colours )
ax.add_collection3d(poly, zs=zs, zdir='y')

ax.set_xlabel('X')
ax.set_xlim3d(800,1150)
ax.set_ylabel('Y')
ax.set_ylim3d(0, 4)
ax.set_zlabel('Z')
ax.set_zlim3d(0, 1)
plt.show()回答 1
Stack Overflow用户
回答已采纳
发布于 2013-12-30 18:45:19
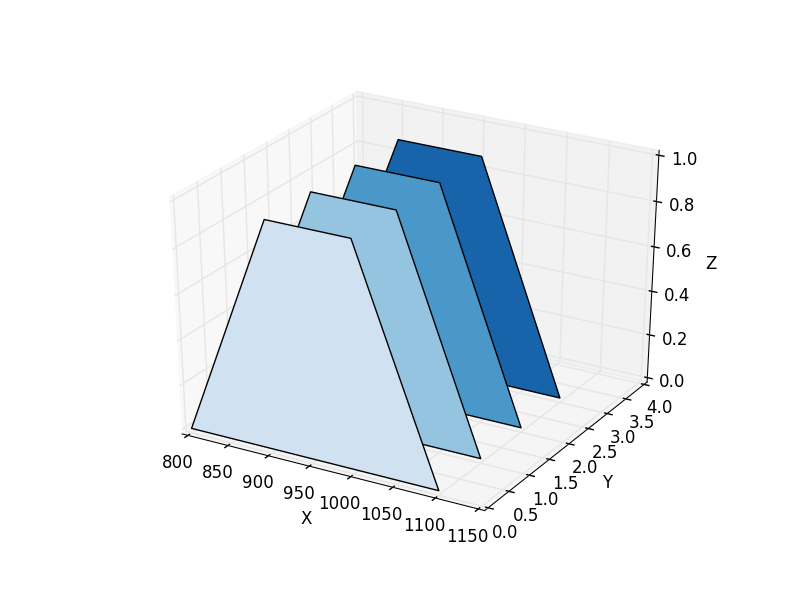
如果您仍然存在此问题,请尝试手动更改相应的路径对象。您应该修改最后一个顶点的代码以停止(代码0):
from mpl_toolkits.mplot3d import Axes3D
from matplotlib.collections import PolyCollection
from matplotlib.colors import colorConverter
import matplotlib.pyplot as plt
import numpy as np

zs = []
fig = plt.figure()
ax = fig.gca(projection='3d')
verts = []

# XY data (i.e. "normal line plots")
count = 4
for i in range(count):
    xs, ys = [800.0, 900.0, 1000.0, 1100.],  [0., 1., 1., 0.]
    verts.append(list(zip(xs, ys)))

# Z position (i.e. depth at which the XY plot is drawn)
zs = [0,1,2,3]

colours = plt.cm.Blues(np.linspace(0.2, 0.8, len(zs)))
poly = PolyCollection(verts, facecolors = colours )

for path in poly.get_paths() :  # There is the fix :
  path.codes[-1] = 0        # we have to manually switch the last point in a path to STOP (code = 0)

ax.add_collection3d(poly, zs=zs, zdir='y')

ax.set_xlabel('X')
ax.set_xlim3d(800,1150)
ax.set_ylabel('Y')
ax.set_ylim3d(0, 4)
ax.set_zlabel('Z')
ax.set_zlim3d(0, 1)
plt.show()
..。其结果是:
页面原文内容由Stack Overflow提供。腾讯云小微IT领域专用引擎提供翻译支持
原文链接:
https://stackoverflow.com/questions/19492007
复制相关文章
相似问题
腾讯云开发者

Copyright © 2013 - 2026 Tencent Cloud. All Rights Reserved. 腾讯云 版权所有
深圳市腾讯计算机系统有限公司 ICP备案/许可证号:粤B2-20090059 ![]() 粤公网安备44030502008569号
粤公网安备44030502008569号
腾讯云计算(北京)有限责任公司 京ICP证150476号 | 京ICP备11018762号