
如何使用matplotlib-basemap正确投影tif图像
如何使用matplotlib-basemap正确投影tif图像
提问于 2013-09-27 06:12:49
我尝试使用gdal和matplotlib-basemap显示光栅图像。
我在这里解释了我使用basemap.interp函数的尝试,关于我的过程的总体结构概述,请查看我的IPython笔记本。首先,我的代码加载和投影光栅。
# Load Raster
pathToRaster = r'I:\Data\anomaly//ano_DOY2002170.tif'
raster = gdal.Open(pathToRaster, gdal.GA_ReadOnly)
array = raster.GetRasterBand(1).ReadAsArray()
msk_array = np.ma.masked_equal(array, value = 65535)
print 'Raster Projection:\n', raster.GetProjection()
print 'Raster GeoTransform:\n', raster.GetGeoTransform()
# Project raster image using Basemap and the basemap.interp function
map = Basemap(projection='robin',resolution='c',lat_0=0,lon_0=0)
datain = np.flipud( msk_array )
nx = raster.RasterXSize
ny = raster.RasterYSize
xin = np.linspace(map.xmin,map.xmax,nx) # nx is the number of x points on the grid
yin = np.linspace(map.ymin,map.ymax,ny) # ny in the number of y points on the grid
lons = np.arange(-180,180,0.25) #from raster.GetGeoTransform()
lats = np.arange(-90,90,0.25)
lons, lats = np.meshgrid(lons,lats)
xout,yout = map(lons, lats)
dataout = mpl_toolkits.basemap.interp(datain, xin, yin, xout, yout, order=1)
levels = [-1000,-800,-600,-400,-200,0,200,400,600,800,1000]
cntr = map.contourf(xout,yout,dataout, levels,cmap=cm.RdBu)
cbar = map.colorbar(cntr,location='bottom',pad='15%')
# Add some more info to the map
cstl = map.drawcoastlines(linewidth=.5)
meri = map.drawmeridians(np.arange(0,360,60), linewidth=.2, labels=[1,0,0,1], labelstyle='+/-', color='grey' )
para = map.drawparallels(np.arange(-90,90,30), linewidth=.2, labels=[1,0,0,1], labelstyle='+/-', color='grey')
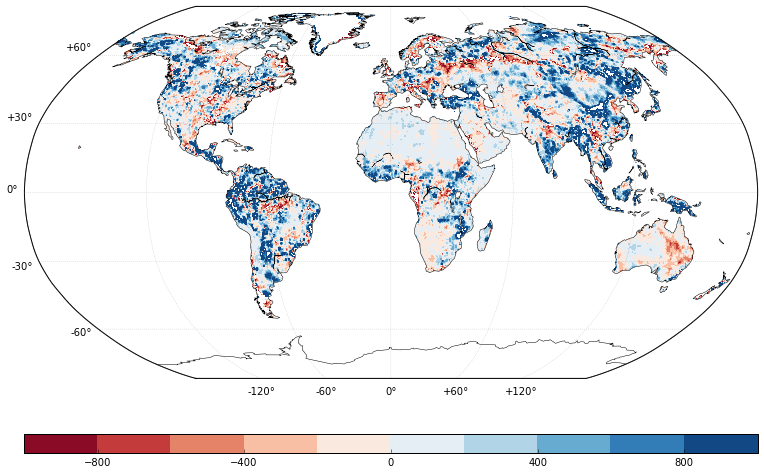
boun = map.drawmapboundary(linewidth=0.5, color='grey')这将画出以下内容:

特别清楚的是,在北美和南美洲的东海岸,光栅数据和海岸线都有偏移。
我不知道如何调整我的代码,所以我的数据将在正确的投影中转换。
关于它的价值:我用过的光栅tif文件 (如果你下载它,它会在'a‘和'no’之间加上一个'-‘,在’ano_DOY.‘之前加上’a‘和’no‘。在“a-no_DOY..”之后)
回答 1
Stack Overflow用户
回答已采纳
发布于 2013-09-27 09:13:26
我不知道你自己的插值/重投影做错了什么,但它可以做得更简单。
contourf接受一个latlon关键字,如果为真,该关键字接受lat/lon输入,并自动将其转换为映射投影。所以:
datain = msk_array

fig = plt.figure(figsize=(12,5))
map = Basemap(projection='robin',resolution='c',lat_0=0,lon_0=0)

ny, nx = datain.shape

xin = np.linspace(map.xmin,map.xmax,nx) # nx is the number of x points on the grid
yin = np.linspace(map.ymin,map.ymax,ny) # ny in the number of y points on the grid

lons = np.arange(-180,180,0.25) #from raster.GetGeoTransform()
lats  = np.arange(90,-90,-0.25)

lons, lats = np.meshgrid(lons,lats)

xx, yy = m(lons,lats)

levels = [-1000,-800,-600,-400,-200,0,200,400,600,800,1000]
cntr = map.contourf(xx, yy,datain, levels,cmap=cm.RdBu)

cbar = map.colorbar(cntr,location='bottom',pad='15%')

# Add some more info to the map
cstl = map.drawcoastlines(linewidth=.5)
meri = map.drawmeridians(np.arange(0,360,60), linewidth=.2, labels=[1,0,0,1], labelstyle='+/-', color='grey' )
para = map.drawparallels(np.arange(-90,90,30), linewidth=.2, labels=[1,0,0,1], labelstyle='+/-', color='grey')
boun = map.drawmapboundary(linewidth=0.5, color='grey')
请注意,我更改了lats定义,以删除输入栅格的翻转,这只是个人偏好。
页面原文内容由Stack Overflow提供。腾讯云小微IT领域专用引擎提供翻译支持
原文链接:
https://stackoverflow.com/questions/19043846
复制相关文章
相似问题
腾讯云开发者

Copyright © 2013 - 2026 Tencent Cloud. All Rights Reserved. 腾讯云 版权所有
深圳市腾讯计算机系统有限公司 ICP备案/许可证号:粤B2-20090059 ![]() 粤公网安备44030502008569号
粤公网安备44030502008569号
腾讯云计算(北京)有限责任公司 京ICP证150476号 | 京ICP备11018762号