
用热图绘制横截面
用热图绘制横截面
提问于 2013-09-20 15:35:16
我有一个数组的形状(201,201),我想通过数据绘制一些横截面,但我有困难访问相关的点。例如,我想画出由图形中的线条所给出的横截面,
from pylab import *
Z = randn(201,201)
x = linspace(-1,1,201)
X,Y = meshgrid(x,x)
pcolormesh(X,Y,Z)
plot(x,x*.5)
我想把这些画在不同的方向,但如果有帮助的话,它们总是会经过原点的.
回答 1
Stack Overflow用户
回答已采纳
发布于 2013-09-20 16:26:26
基本上,您希望沿一条线(或任意路径)内插2D网格。
首先,您应该决定是要插值网格还是只进行最近邻抽样。如果你想做后一件事,你可以只使用索引。
如果您想插值,请看一看scipy.ndimage.map_coordinates。一开始很难把你的头绕起来,但这对你来说是完美的。(这比使用假设数据点是随机分布的插值例程要有效得多。)
我会给出两者的一个例子。但是,在这些示例中,所有内容都是以“像素”(即行、列)坐标绘制的。
在您的例子中,您在一个与“像素”坐标不同的坐标系中工作,因此您需要将"world“(即x,y)坐标转换为”像素“坐标进行插值。
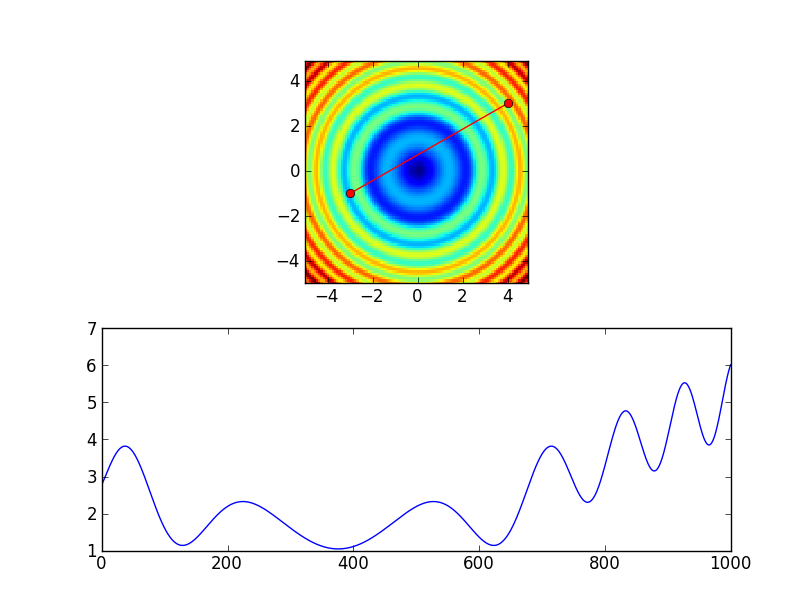
首先,这里有一个与map_coordinates一起使用三次插值的例子
import numpy as np
import scipy.ndimage
import matplotlib.pyplot as plt

# Generate some data...
x, y = np.mgrid[-5:5:0.1, -5:5:0.1]
z = np.sqrt(x**2 + y**2) + np.sin(x**2 + y**2)

# Coordinates of the line we'd like to sample along
line = [(-3, -1), (4, 3)]

# Convert the line to pixel/index coordinates
x_world, y_world = np.array(zip(*line))
col = z.shape[1] * (x_world - x.min()) / x.ptp()
row = z.shape[0] * (y_world - y.min()) / y.ptp()

# Interpolate the line at "num" points...
num = 1000
row, col = [np.linspace(item[0], item[1], num) for item in [row, col]]

# Extract the values along the line, using cubic interpolation
zi = scipy.ndimage.map_coordinates(z, np.vstack((row, col)))

# Plot...
fig, axes = plt.subplots(nrows=2)
axes[0].pcolormesh(x, y, z)
axes[0].plot(x_world, y_world, 'ro-')
axes[0].axis('image')

axes[1].plot(zi)

plt.show()
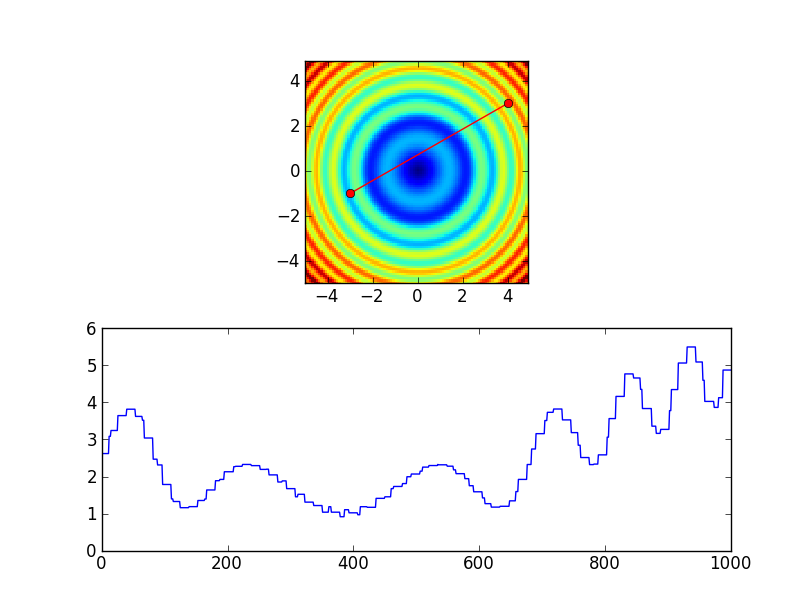
另外,我们也可以使用最近邻插值.这样做的一种方法是在上面的示例中将order=0传递给map_coordinates。相反,我将使用索引来展示另一种方法。如果我们改变路线
# Extract the values along the line, using cubic interpolation
zi = scipy.ndimage.map_coordinates(z, np.vstack((row, col)))
至:
# Extract the values along the line, using nearest-neighbor interpolation
zi = z[row.astype(int), col.astype(int)]
我们会得到:
页面原文内容由Stack Overflow提供。腾讯云小微IT领域专用引擎提供翻译支持
原文链接:
https://stackoverflow.com/questions/18920614
复制相关文章
相似问题
腾讯云开发者

Copyright © 2013 - 2026 Tencent Cloud. All Rights Reserved. 腾讯云 版权所有
深圳市腾讯计算机系统有限公司 ICP备案/许可证号:粤B2-20090059 ![]() 粤公网安备44030502008569号
粤公网安备44030502008569号
腾讯云计算(北京)有限责任公司 京ICP证150476号 | 京ICP备11018762号