
如何使用CSS3 3/HTML5 5创建切片圆?
如何使用CSS3 3/HTML5 5创建切片圆?
提问于 2013-08-22 17:47:27
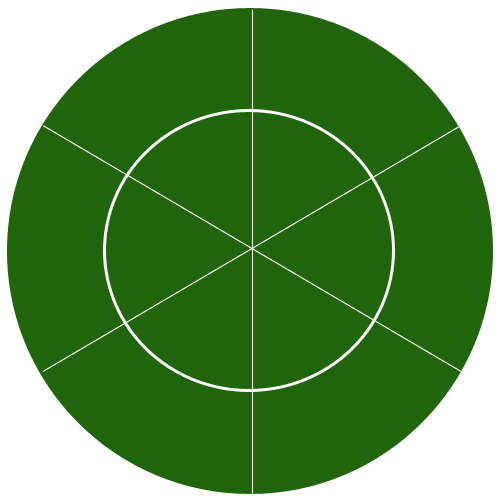
请帮助我创建一个切片的圆圈,在这里我可以点击每个切片来提供不同的命令,就像我们在按钮中所做的那样。切片必须如下所示:
- 2圈,主外圆,内圆(半大小为外圆),
- 在主圆上的3条线,将两个圆划分为12片。这三条线的直线应该是垂直线。
参考图像:
.maincircle {
  height: 404px;
  width: 404px;
}

.slice1 {
  float: left;
  height: 200px;
  width: 200px;
  border: 1px solid #000;
  background-color: #093;
  cursor: pointer;
  border-radius: 190px 0 0 0;
  -moz-border-radius: 190px 0 0 0;
  -webkit-border-radius: 190px 0 0 0;
}

.slice1:hover {
  background-color: #6C6;
}

.slice2 {
  float: left;
  height: 200px;
  width: 200px;
  border: 1px solid #000;
  background-color: #093;
  cursor: pointer;
  -moz-border-radius: 0 190px 0 0;
  -webkit-border-radius: 0 190px 0 0;
}

.slice2:hover {
  background-color: #6C6;
}

.slice3 {
  float: left;
  height: 200px;
  width: 200px;
  border: 1px solid #000;
  background-color: #093;
  cursor: pointer;
  -moz-border-radius: 0 0 0 190px;
  -webkit-border-radius: 0 0 0 190px;
}

.slice3:hover {
  background-color: #6C6;
}

.slice4 {
  float: left;
  height: 200px;
  width: 200px;
  border: 1px solid #000;
  background-color: #093;
  cursor: pointer;
  -moz-border-radius: 0 0 190px 0;
  -webkit-border-radius: 0 0 190px 0;
}

.slice4:hover {
  background-color: #6C6;
}<div class="maincircle">
<div class="slice1"></div>
<div class="slice2"></div>
<div class="slice3"></div>
<div class="slice4"></div>
</div>
回答 2
Stack Overflow用户
回答已采纳
发布于 2013-08-22 18:01:29
下面是我将采取的方法的一个快速例子
演示http://jsfiddle.net/kevinPHPkevin/XN3ZB/314/
我用http://code.highcharts.com/highcharts.js来做这样的事情。这意味着使用饼图,你可以根据你的需要来设计它们,并让它们表现出你喜欢的样子。它是非常快速和简单的。
编辑
更新为多层
$(document).ready(function() {
  Highcharts.setOptions({
    colors: ['#2a6705']
  });

  RenderPieChart('container', [
    ['one piece', 15.6],
    ['one piece', 15.6],
    ['one piece', 15.6],
    ['one piece', 15.6],
    ['one piece', 15.6],
    ['one piece', 15.6],
  ]);

  function RenderPieChart(elementId, dataList) {
    new Highcharts.Chart({
      chart: {
        renderTo: elementId,
        plotBackgroundColor: null,
        plotBorderWidth: null,
        plotShadow: false
      },
      title: {
        text: 'Use a pie chart for more than just data'
      },
      tooltip: {
        formatter: function() {

          return '<b> Add an event here</b>';

        }
      },
      plotOptions: {
        pie: {
          allowPointSelect: true,
          cursor: 'pointer',
          dataLabels: {
            enabled: true,
            color: '#000000',
            connectorColor: '#000000',
            formatter: function() {
              return '<b>Make these clickable</b>';
            }
          }
        }
      },
      series: [{
        type: 'pie',
        name: 'Browser share',
        data: dataList
      }, {
        type: 'pie',
        name: 'Browser share',
        data: dataList,
        innerSize: '70%'
      }]
    });
  };
});<script src="https://ajax.googleapis.com/ajax/libs/jquery/1.6.4/jquery.min.js"></script>
<script src="https://code.highcharts.com/highcharts.js"></script>
<script src="https://code.highcharts.com/modules/exporting.js"></script>
<div id="container" style="min-width: 400px; height: 400px; margin: 0 auto"></div>
Stack Overflow用户
发布于 2013-08-22 19:42:16
我发现这很有趣,所以我继续在SVG中创建它:
path:hover {
  fill: blue;
}<svg height="440px" width="440px">
<path d="M 220 220 L 270 306.60254037844385 A 100 100 0 0 0 320 220 z" fill="green" stroke="white" onclick="alert('inner-0')" />
<path d="M 420 220 A 200 200 0 0 1 320 393.2050807568877 L 270 306.60254037844385 A 100 100 0 0 0 320 220 z" fill="green" stroke="white" onclick="alert('outer-0')" />
<path d="M 220 220 L 170.00000000000003 306.6025403784439 A 100 100 0 0 0 270 306.60254037844385 z" fill="green" stroke="white" onclick="alert('inner-1')" />
<path d="M 320 393.2050807568877 A 200 200 0 0 1 120.00000000000004 393.20508075688775 L 170.00000000000003 306.6025403784439 A 100 100 0 0 0 270 306.60254037844385 z" fill="green" stroke="white" onclick="alert('outer-1')" />
<path d="M 220 220 L 120 220 A 100 100 0 0 0 170.00000000000003 306.6025403784439 z" fill="green" stroke="white" onclick="alert('inner-2')" />
<path d="M 120.00000000000004 393.20508075688775 A 200 200 0 0 1 20 220.00000000000003 L 120 220 A 100 100 0 0 0 170.00000000000003 306.6025403784439 z" fill="green" stroke="white" onclick="alert('outer-2')" />
<path d="M 220 220 L 169.99999999999994 133.39745962155615 A 100 100 0 0 0 120 220 z" fill="green" stroke="white" onclick="alert('inner-3')" />
<path d="M 20 220.00000000000003 A 200 200 0 0 1 119.99999999999991 46.79491924311233 L 169.99999999999994 133.39745962155615 A 100 100 0 0 0 120 220 z" fill="green" stroke="white" onclick="alert('outer-3')" />
<path d="M 220 220 L 269.99999999999994 133.3974596215561 A 100 100 0 0 0 169.99999999999994 133.39745962155615 z" fill="green" stroke="white" onclick="alert('inner-4')" />
<path d="M 119.99999999999991 46.79491924311233 A 200 200 0 0 1 319.9999999999999 46.79491924311219 L 269.99999999999994 133.3974596215561 A 100 100 0 0 0 169.99999999999994 133.39745962155615 z" fill="green" stroke="white" onclick="alert('outer-4')"
/>
<path d="M 220 220 L 320 219.99999999999997 A 100 100 0 0 0 269.99999999999994 133.3974596215561 z" fill="green" stroke="white" onclick="alert('inner-5')" />
<path d="M 319.9999999999999 46.79491924311219 A 200 200 0 0 1 420 219.99999999999994 L 320 219.99999999999997 A 100 100 0 0 0 269.99999999999994 133.3974596215561 z" fill="green" stroke="white" onclick="alert('outer-5')" />
</svg>
如果有人感兴趣,我用以下(丑陋)代码生成了这个代码:
var RADIUS = 200;
var PADDING = 20;
var SLICES = 6;

var svg = "";

for (var i = 0; i < SLICES; i++) {
  var p1 = {
    x: Math.cos(Math.PI * 2 / SLICES * i) * RADIUS + RADIUS + PADDING,
    y: Math.sin(Math.PI * 2 / SLICES * i) * RADIUS + RADIUS + PADDING
  };

  var p2 = {
    x: Math.cos(Math.PI * 2 / SLICES * (i + 1)) * RADIUS + RADIUS + PADDING,
    y: Math.sin(Math.PI * 2 / SLICES * (i + 1)) * RADIUS + RADIUS + PADDING
  };

  var p4 = {
    x: Math.cos(Math.PI * 2 / SLICES * i) * (RADIUS / 2) + RADIUS + PADDING,
    y: Math.sin(Math.PI * 2 / SLICES * i) * (RADIUS / 2) + RADIUS + PADDING
  };

  var p3 = {
    x: Math.cos(Math.PI * 2 / SLICES * (i + 1)) * (RADIUS / 2) + RADIUS + PADDING,
    y: Math.sin(Math.PI * 2 / SLICES * (i + 1)) * (RADIUS / 2) + RADIUS + PADDING
  };


  svg += "<path d='M " + (RADIUS + PADDING) + " " + (RADIUS + PADDING) + " L " + p3.x + " " + p3.y + " A " + (RADIUS / 2) + " " + (RADIUS / 2) + " 0 0 0 " + p4.x + " " + p4.y + " z' fill='green' stroke='white' onclick='alert(\"inner-" + i + "\")'/>";

  svg += "<path d='M " + p1.x + " " + p1.y + " A " + RADIUS + " " + RADIUS + " 0 0 1 " + p2.x + " " + p2.y + "  L " + p3.x + " " + p3.y + " A " + RADIUS / 2 + " " + RADIUS / 2 + " 0 0 0 " + p4.x + " " + p4.y + "  z' fill='green' stroke='white' onclick='alert(\"outer-" + i + "\")'/>";
}

svg = "<svg height='" + (RADIUS * 2 + PADDING * 2) + "px' width='" + (RADIUS * 2 + PADDING * 2) + "px'>" + svg + "</svg>";

$("body").append(svg);<script src="https://ajax.googleapis.com/ajax/libs/jquery/1.10.1/jquery.min.js"></script>
页面原文内容由Stack Overflow提供。腾讯云小微IT领域专用引擎提供翻译支持
原文链接:
https://stackoverflow.com/questions/18387405
复制相关文章
相似问题
腾讯云开发者

Copyright © 2013 - 2026 Tencent Cloud. All Rights Reserved. 腾讯云 版权所有
深圳市腾讯计算机系统有限公司 ICP备案/许可证号:粤B2-20090059 ![]() 粤公网安备44030502008569号
粤公网安备44030502008569号
腾讯云计算(北京)有限责任公司 京ICP证150476号 | 京ICP备11018762号