
具有伽玛参数的梯度颜色标度?
具有伽玛参数的梯度颜色标度?
提问于 2013-08-03 20:10:42
我有一些非常微弱的对比度和相当多的噪音的成像数据,当我用线性的彩色标度显示它时,它显示得不太好。在成像软件,如imageJ或photoshop,有一个色调曲线,人们可以调整,以一种非线性的方式碰撞对比,并有效地拉伸在某个感兴趣地区的规模,以了解更多的细节。
作为这种非线性调谐参数的最简单的例子,@BrianDiggs指出了bias参数给colorRamp,它仍然要求数据的先前变换为0,1。我想把非线性标度推广到x^gamma以外的其他泛函,因此下面的函数实际上并不在colorRamp中使用bias,而是在数据方面进行转换。
我觉得我在重新发明轮子,在R中已经有这样一个工具用于连续的彩色刻度了吗?
回答 1
Stack Overflow用户
回答已采纳
发布于 2016-03-01 08:34:59
这里有一个可能的解决方案,
set.seed(123)
x <- sort(runif(1e4, min=-20 , max=120))
library(scales) # rescale function
curve_pal <- function (x, colours = rev(blues9),
fun = function(x) x^gamma,
n=10, gamma=1)
{
# function that maps [0,1] -> colours
palfun <- colorRamp(colors=colours)
# now divide the data in n equi-spaced regions, mapped linearly to [0,1]
xcuts <- cut(x, breaks=seq(min(x), max(x), length=n))
xnum <- as.numeric(xcuts)
# need to work around NA values that make colorRamp/rgb choke
testNA <- is.na(xnum)
xsanitised <- ifelse(testNA, 0, fun(rescale(xnum)))
# non-NA values in [0,1] get assigned their colour
ifelse(testNA, NA, rgb(palfun(xsanitised), maxColorValue=255))
}
library(gridExtra)
grid.newpage()
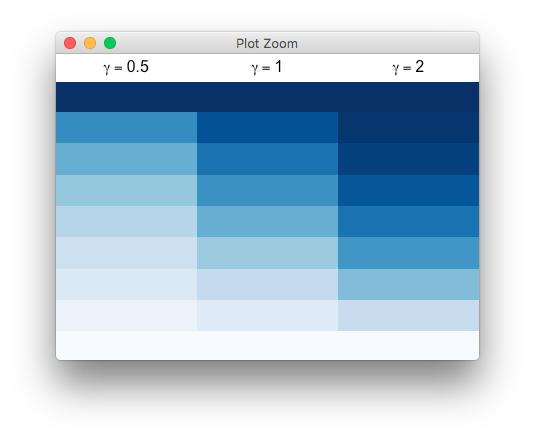
grid.arrange(rasterGrob(curve_pal(x, gamma=0.5), wid=1, heig=1, int=F),
rasterGrob(curve_pal(x, gamma=1), wid=1, heig=1, int=F),
rasterGrob(curve_pal(x, gamma=2), wid=1, heig=1, int=F),
nrow=1)
页面原文内容由Stack Overflow提供。腾讯云小微IT领域专用引擎提供翻译支持
原文链接:
https://stackoverflow.com/questions/18036849
复制相关文章
相似问题
腾讯云开发者

Copyright © 2013 - 2026 Tencent Cloud. All Rights Reserved. 腾讯云 版权所有
深圳市腾讯计算机系统有限公司 ICP备案/许可证号:粤B2-20090059 ![]() 粤公网安备44030502008569号
粤公网安备44030502008569号
腾讯云计算(北京)有限责任公司 京ICP证150476号 | 京ICP备11018762号